White/Caucasian vs Creek Female Poverty Among 18-24 Year Olds
COMPARE
White/Caucasian
Creek
Female Poverty Among 18-24 Year Olds
Female Poverty Among 18-24 Year Olds Comparison
Whites/Caucasians
Creek
20.8%
FEMALE POVERTY AMONG 18-24 YEAR OLDS
6.1/ 100
METRIC RATING
230th/ 347
METRIC RANK
24.2%
FEMALE POVERTY AMONG 18-24 YEAR OLDS
0.0/ 100
METRIC RATING
313th/ 347
METRIC RANK
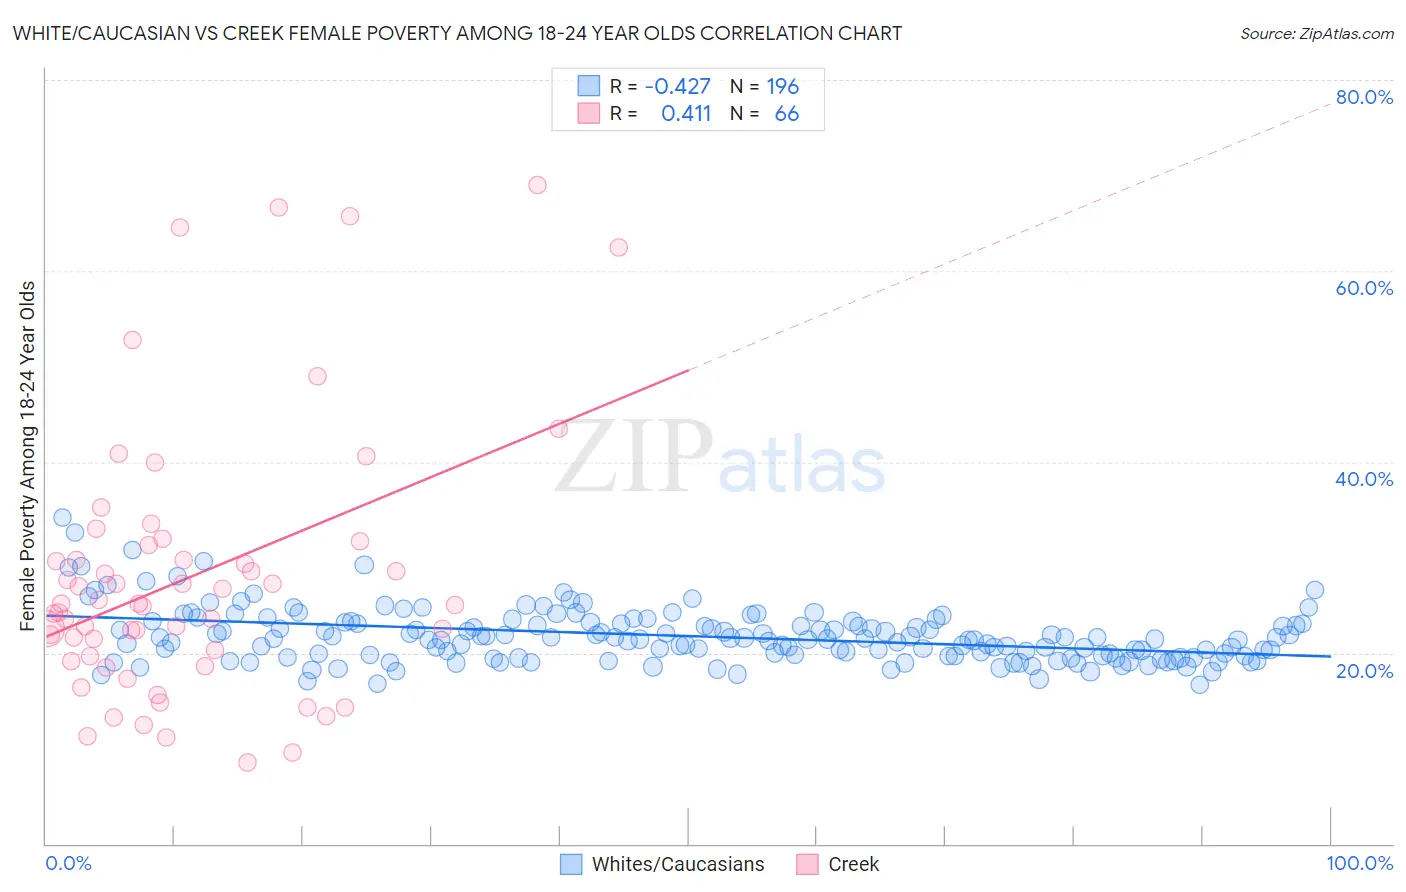
White/Caucasian vs Creek Female Poverty Among 18-24 Year Olds Correlation Chart
The statistical analysis conducted on geographies consisting of 545,122,954 people shows a moderate negative correlation between the proportion of Whites/Caucasians and poverty level among females between the ages 18 and 24 in the United States with a correlation coefficient (R) of -0.427 and weighted average of 20.8%. Similarly, the statistical analysis conducted on geographies consisting of 176,646,944 people shows a moderate positive correlation between the proportion of Creek and poverty level among females between the ages 18 and 24 in the United States with a correlation coefficient (R) of 0.411 and weighted average of 24.2%, a difference of 16.6%.
Female Poverty Among 18-24 Year Olds Correlation Summary
| Measurement | White/Caucasian | Creek |
| Minimum | 16.7% | 8.5% |
| Maximum | 34.2% | 69.0% |
| Range | 17.5% | 60.4% |
| Mean | 21.7% | 28.0% |
| Median | 21.4% | 25.1% |
| Interquartile 25% (IQ1) | 19.7% | 19.7% |
| Interquartile 75% (IQ3) | 23.1% | 31.3% |
| Interquartile Range (IQR) | 3.5% | 11.7% |
| Standard Deviation (Sample) | 2.9% | 14.0% |
| Standard Deviation (Population) | 2.8% | 13.9% |
Similar Demographics by Female Poverty Among 18-24 Year Olds
Demographics Similar to Whites/Caucasians by Female Poverty Among 18-24 Year Olds
In terms of female poverty among 18-24 year olds, the demographic groups most similar to Whites/Caucasians are Australian (20.8%, a difference of 0.0%), Immigrants from St. Vincent and the Grenadines (20.8%, a difference of 0.020%), Finnish (20.8%, a difference of 0.030%), Immigrants from Denmark (20.8%, a difference of 0.060%), and Ghanaian (20.8%, a difference of 0.070%).
| Demographics | Rating | Rank | Female Poverty Among 18-24 Year Olds |
| French | 7.9 /100 | #223 | Tragic 20.7% |
| Immigrants | Liberia | 7.6 /100 | #224 | Tragic 20.7% |
| Norwegians | 7.3 /100 | #225 | Tragic 20.7% |
| Estonians | 7.2 /100 | #226 | Tragic 20.7% |
| Immigrants | Sweden | 6.8 /100 | #227 | Tragic 20.7% |
| Ghanaians | 6.5 /100 | #228 | Tragic 20.8% |
| Australians | 6.1 /100 | #229 | Tragic 20.8% |
| Whites/Caucasians | 6.1 /100 | #230 | Tragic 20.8% |
| Immigrants | St. Vincent and the Grenadines | 6.0 /100 | #231 | Tragic 20.8% |
| Finns | 6.0 /100 | #232 | Tragic 20.8% |
| Immigrants | Denmark | 5.8 /100 | #233 | Tragic 20.8% |
| Welsh | 5.4 /100 | #234 | Tragic 20.8% |
| Immigrants | Uganda | 5.1 /100 | #235 | Tragic 20.8% |
| Okinawans | 4.9 /100 | #236 | Tragic 20.8% |
| Scottish | 4.5 /100 | #237 | Tragic 20.9% |
Demographics Similar to Creek by Female Poverty Among 18-24 Year Olds
In terms of female poverty among 18-24 year olds, the demographic groups most similar to Creek are Choctaw (24.3%, a difference of 0.16%), Black/African American (24.3%, a difference of 0.36%), Alsatian (24.4%, a difference of 0.67%), Osage (24.5%, a difference of 0.97%), and Chickasaw (24.5%, a difference of 1.1%).
| Demographics | Rating | Rank | Female Poverty Among 18-24 Year Olds |
| Paiute | 0.0 /100 | #306 | Tragic 23.3% |
| Cree | 0.0 /100 | #307 | Tragic 23.4% |
| Immigrants | Sudan | 0.0 /100 | #308 | Tragic 23.5% |
| Blackfeet | 0.0 /100 | #309 | Tragic 23.6% |
| Comanche | 0.0 /100 | #310 | Tragic 23.6% |
| Potawatomi | 0.0 /100 | #311 | Tragic 23.7% |
| Yuman | 0.0 /100 | #312 | Tragic 24.0% |
| Creek | 0.0 /100 | #313 | Tragic 24.2% |
| Choctaw | 0.0 /100 | #314 | Tragic 24.3% |
| Blacks/African Americans | 0.0 /100 | #315 | Tragic 24.3% |
| Alsatians | 0.0 /100 | #316 | Tragic 24.4% |
| Osage | 0.0 /100 | #317 | Tragic 24.5% |
| Chickasaw | 0.0 /100 | #318 | Tragic 24.5% |
| Dutch West Indians | 0.0 /100 | #319 | Tragic 24.5% |
| Immigrants | Congo | 0.0 /100 | #320 | Tragic 24.6% |