White/Caucasian vs American Female Poverty Among 18-24 Year Olds
COMPARE
White/Caucasian
American
Female Poverty Among 18-24 Year Olds
Female Poverty Among 18-24 Year Olds Comparison
Whites/Caucasians
Americans
20.8%
FEMALE POVERTY AMONG 18-24 YEAR OLDS
6.1/ 100
METRIC RATING
230th/ 347
METRIC RANK
21.6%
FEMALE POVERTY AMONG 18-24 YEAR OLDS
0.3/ 100
METRIC RATING
267th/ 347
METRIC RANK
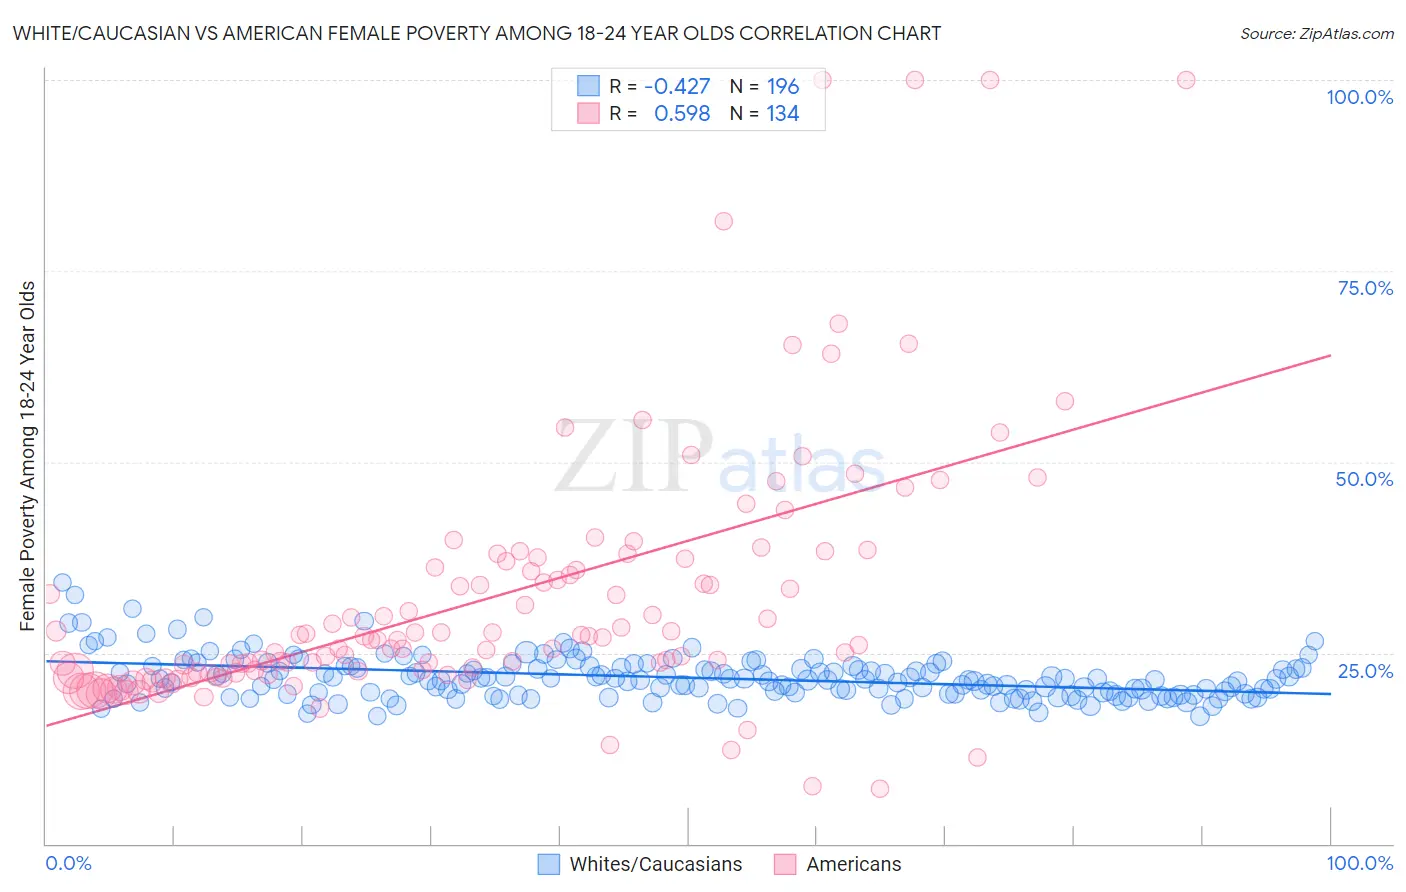
White/Caucasian vs American Female Poverty Among 18-24 Year Olds Correlation Chart
The statistical analysis conducted on geographies consisting of 545,122,954 people shows a moderate negative correlation between the proportion of Whites/Caucasians and poverty level among females between the ages 18 and 24 in the United States with a correlation coefficient (R) of -0.427 and weighted average of 20.8%. Similarly, the statistical analysis conducted on geographies consisting of 544,575,650 people shows a substantial positive correlation between the proportion of Americans and poverty level among females between the ages 18 and 24 in the United States with a correlation coefficient (R) of 0.598 and weighted average of 21.6%, a difference of 3.7%.
Female Poverty Among 18-24 Year Olds Correlation Summary
| Measurement | White/Caucasian | American |
| Minimum | 16.7% | 7.1% |
| Maximum | 34.2% | 100.0% |
| Range | 17.5% | 92.9% |
| Mean | 21.7% | 32.2% |
| Median | 21.4% | 26.7% |
| Interquartile 25% (IQ1) | 19.7% | 22.4% |
| Interquartile 75% (IQ3) | 23.1% | 37.0% |
| Interquartile Range (IQR) | 3.5% | 14.6% |
| Standard Deviation (Sample) | 2.9% | 17.1% |
| Standard Deviation (Population) | 2.8% | 17.1% |
Similar Demographics by Female Poverty Among 18-24 Year Olds
Demographics Similar to Whites/Caucasians by Female Poverty Among 18-24 Year Olds
In terms of female poverty among 18-24 year olds, the demographic groups most similar to Whites/Caucasians are Australian (20.8%, a difference of 0.0%), Immigrants from St. Vincent and the Grenadines (20.8%, a difference of 0.020%), Finnish (20.8%, a difference of 0.030%), Immigrants from Denmark (20.8%, a difference of 0.060%), and Ghanaian (20.8%, a difference of 0.070%).
| Demographics | Rating | Rank | Female Poverty Among 18-24 Year Olds |
| French | 7.9 /100 | #223 | Tragic 20.7% |
| Immigrants | Liberia | 7.6 /100 | #224 | Tragic 20.7% |
| Norwegians | 7.3 /100 | #225 | Tragic 20.7% |
| Estonians | 7.2 /100 | #226 | Tragic 20.7% |
| Immigrants | Sweden | 6.8 /100 | #227 | Tragic 20.7% |
| Ghanaians | 6.5 /100 | #228 | Tragic 20.8% |
| Australians | 6.1 /100 | #229 | Tragic 20.8% |
| Whites/Caucasians | 6.1 /100 | #230 | Tragic 20.8% |
| Immigrants | St. Vincent and the Grenadines | 6.0 /100 | #231 | Tragic 20.8% |
| Finns | 6.0 /100 | #232 | Tragic 20.8% |
| Immigrants | Denmark | 5.8 /100 | #233 | Tragic 20.8% |
| Welsh | 5.4 /100 | #234 | Tragic 20.8% |
| Immigrants | Uganda | 5.1 /100 | #235 | Tragic 20.8% |
| Okinawans | 4.9 /100 | #236 | Tragic 20.8% |
| Scottish | 4.5 /100 | #237 | Tragic 20.9% |
Demographics Similar to Americans by Female Poverty Among 18-24 Year Olds
In terms of female poverty among 18-24 year olds, the demographic groups most similar to Americans are Alaska Native (21.5%, a difference of 0.080%), Nonimmigrants (21.5%, a difference of 0.15%), Immigrants from Burma/Myanmar (21.6%, a difference of 0.15%), Honduran (21.5%, a difference of 0.16%), and Icelander (21.5%, a difference of 0.21%).
| Demographics | Rating | Rank | Female Poverty Among 18-24 Year Olds |
| Immigrants | Norway | 0.6 /100 | #260 | Tragic 21.4% |
| Immigrants | Bahamas | 0.5 /100 | #261 | Tragic 21.4% |
| Immigrants | Eastern Africa | 0.4 /100 | #262 | Tragic 21.4% |
| Icelanders | 0.3 /100 | #263 | Tragic 21.5% |
| Hondurans | 0.3 /100 | #264 | Tragic 21.5% |
| Immigrants | Nonimmigrants | 0.3 /100 | #265 | Tragic 21.5% |
| Alaska Natives | 0.3 /100 | #266 | Tragic 21.5% |
| Americans | 0.3 /100 | #267 | Tragic 21.6% |
| Immigrants | Burma/Myanmar | 0.2 /100 | #268 | Tragic 21.6% |
| Celtics | 0.2 /100 | #269 | Tragic 21.6% |
| Mongolians | 0.2 /100 | #270 | Tragic 21.6% |
| Scotch-Irish | 0.2 /100 | #271 | Tragic 21.6% |
| Basques | 0.2 /100 | #272 | Tragic 21.7% |
| New Zealanders | 0.2 /100 | #273 | Tragic 21.7% |
| Immigrants | Honduras | 0.1 /100 | #274 | Tragic 21.8% |