Hopi vs Creek Female Poverty Among 18-24 Year Olds
COMPARE
Hopi
Creek
Female Poverty Among 18-24 Year Olds
Female Poverty Among 18-24 Year Olds Comparison
Hopi
Creek
28.2%
FEMALE POVERTY AMONG 18-24 YEAR OLDS
0.0/ 100
METRIC RATING
338th/ 347
METRIC RANK
24.2%
FEMALE POVERTY AMONG 18-24 YEAR OLDS
0.0/ 100
METRIC RATING
313th/ 347
METRIC RANK
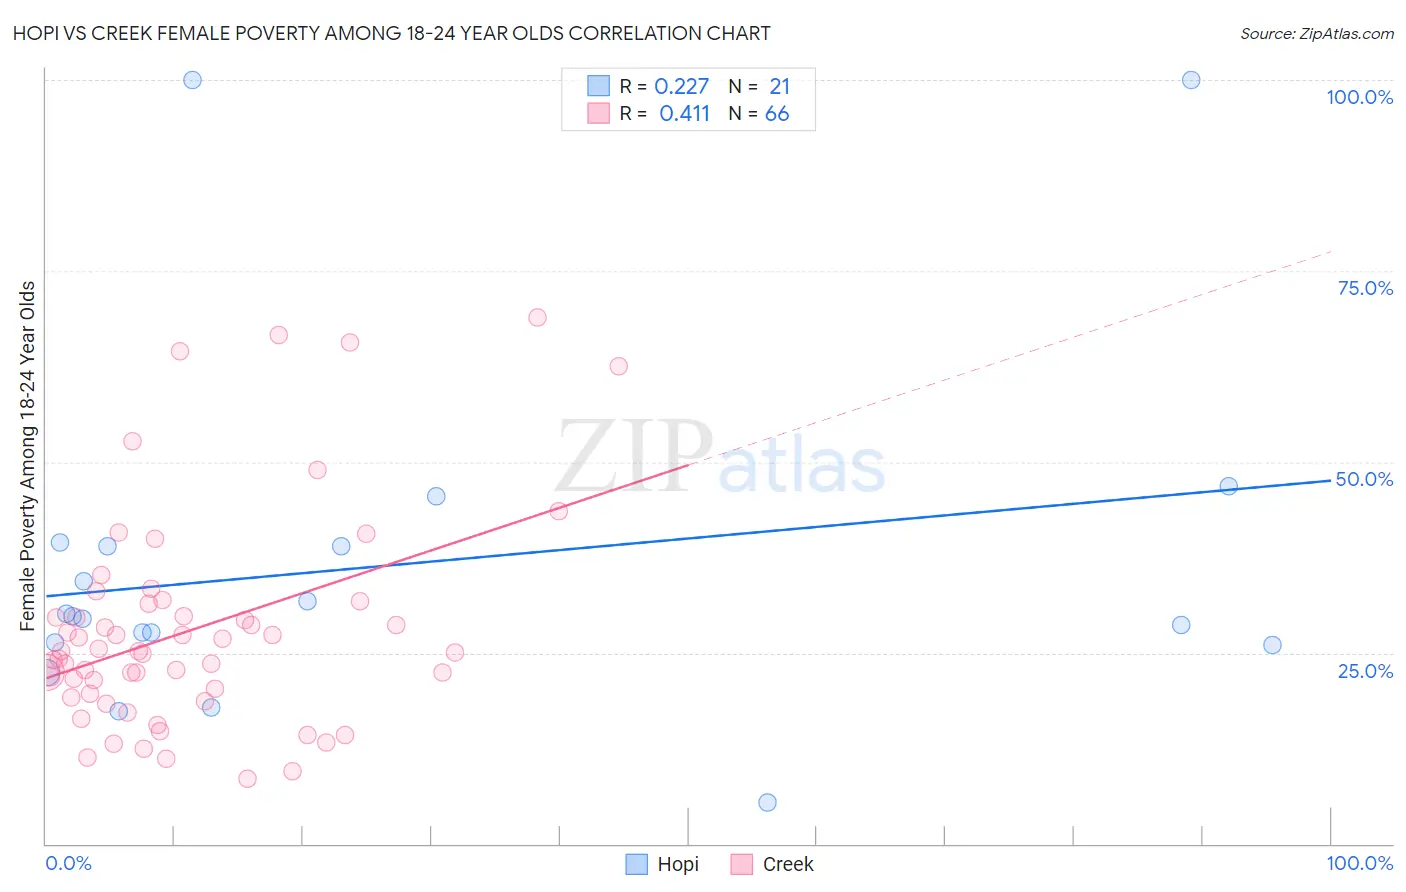
Hopi vs Creek Female Poverty Among 18-24 Year Olds Correlation Chart
The statistical analysis conducted on geographies consisting of 74,465,838 people shows a weak positive correlation between the proportion of Hopi and poverty level among females between the ages 18 and 24 in the United States with a correlation coefficient (R) of 0.227 and weighted average of 28.2%. Similarly, the statistical analysis conducted on geographies consisting of 176,646,944 people shows a moderate positive correlation between the proportion of Creek and poverty level among females between the ages 18 and 24 in the United States with a correlation coefficient (R) of 0.411 and weighted average of 24.2%, a difference of 16.5%.
Female Poverty Among 18-24 Year Olds Correlation Summary
| Measurement | Hopi | Creek |
| Minimum | 5.4% | 8.5% |
| Maximum | 100.0% | 69.0% |
| Range | 94.6% | 60.4% |
| Mean | 36.4% | 28.0% |
| Median | 29.7% | 25.1% |
| Interquartile 25% (IQ1) | 26.3% | 19.7% |
| Interquartile 75% (IQ3) | 39.2% | 31.3% |
| Interquartile Range (IQR) | 13.0% | 11.7% |
| Standard Deviation (Sample) | 23.2% | 14.0% |
| Standard Deviation (Population) | 22.6% | 13.9% |
Similar Demographics by Female Poverty Among 18-24 Year Olds
Demographics Similar to Hopi by Female Poverty Among 18-24 Year Olds
In terms of female poverty among 18-24 year olds, the demographic groups most similar to Hopi are Cheyenne (28.1%, a difference of 0.21%), Pima (28.4%, a difference of 0.72%), Sioux (28.6%, a difference of 1.3%), Immigrants from Yemen (27.5%, a difference of 2.4%), and Colville (29.0%, a difference of 2.9%).
| Demographics | Rating | Rank | Female Poverty Among 18-24 Year Olds |
| Chippewa | 0.0 /100 | #331 | Tragic 25.9% |
| Houma | 0.0 /100 | #332 | Tragic 26.2% |
| Apache | 0.0 /100 | #333 | Tragic 26.3% |
| Pueblo | 0.0 /100 | #334 | Tragic 26.9% |
| Yup'ik | 0.0 /100 | #335 | Tragic 27.0% |
| Immigrants | Yemen | 0.0 /100 | #336 | Tragic 27.5% |
| Cheyenne | 0.0 /100 | #337 | Tragic 28.1% |
| Hopi | 0.0 /100 | #338 | Tragic 28.2% |
| Pima | 0.0 /100 | #339 | Tragic 28.4% |
| Sioux | 0.0 /100 | #340 | Tragic 28.6% |
| Colville | 0.0 /100 | #341 | Tragic 29.0% |
| Kiowa | 0.0 /100 | #342 | Tragic 29.2% |
| Puerto Ricans | 0.0 /100 | #343 | Tragic 29.8% |
| Navajo | 0.0 /100 | #344 | Tragic 30.3% |
| Tohono O'odham | 0.0 /100 | #345 | Tragic 31.0% |
Demographics Similar to Creek by Female Poverty Among 18-24 Year Olds
In terms of female poverty among 18-24 year olds, the demographic groups most similar to Creek are Choctaw (24.3%, a difference of 0.16%), Black/African American (24.3%, a difference of 0.36%), Alsatian (24.4%, a difference of 0.67%), Osage (24.5%, a difference of 0.97%), and Chickasaw (24.5%, a difference of 1.1%).
| Demographics | Rating | Rank | Female Poverty Among 18-24 Year Olds |
| Paiute | 0.0 /100 | #306 | Tragic 23.3% |
| Cree | 0.0 /100 | #307 | Tragic 23.4% |
| Immigrants | Sudan | 0.0 /100 | #308 | Tragic 23.5% |
| Blackfeet | 0.0 /100 | #309 | Tragic 23.6% |
| Comanche | 0.0 /100 | #310 | Tragic 23.6% |
| Potawatomi | 0.0 /100 | #311 | Tragic 23.7% |
| Yuman | 0.0 /100 | #312 | Tragic 24.0% |
| Creek | 0.0 /100 | #313 | Tragic 24.2% |
| Choctaw | 0.0 /100 | #314 | Tragic 24.3% |
| Blacks/African Americans | 0.0 /100 | #315 | Tragic 24.3% |
| Alsatians | 0.0 /100 | #316 | Tragic 24.4% |
| Osage | 0.0 /100 | #317 | Tragic 24.5% |
| Chickasaw | 0.0 /100 | #318 | Tragic 24.5% |
| Dutch West Indians | 0.0 /100 | #319 | Tragic 24.5% |
| Immigrants | Congo | 0.0 /100 | #320 | Tragic 24.6% |