Welsh vs Burmese Receiving Food Stamps
COMPARE
Welsh
Burmese
Receiving Food Stamps
Receiving Food Stamps Comparison
Welsh
Burmese
10.3%
RECEIVING FOOD STAMPS
97.3/ 100
METRIC RATING
96th/ 347
METRIC RANK
8.6%
RECEIVING FOOD STAMPS
99.9/ 100
METRIC RATING
8th/ 347
METRIC RANK
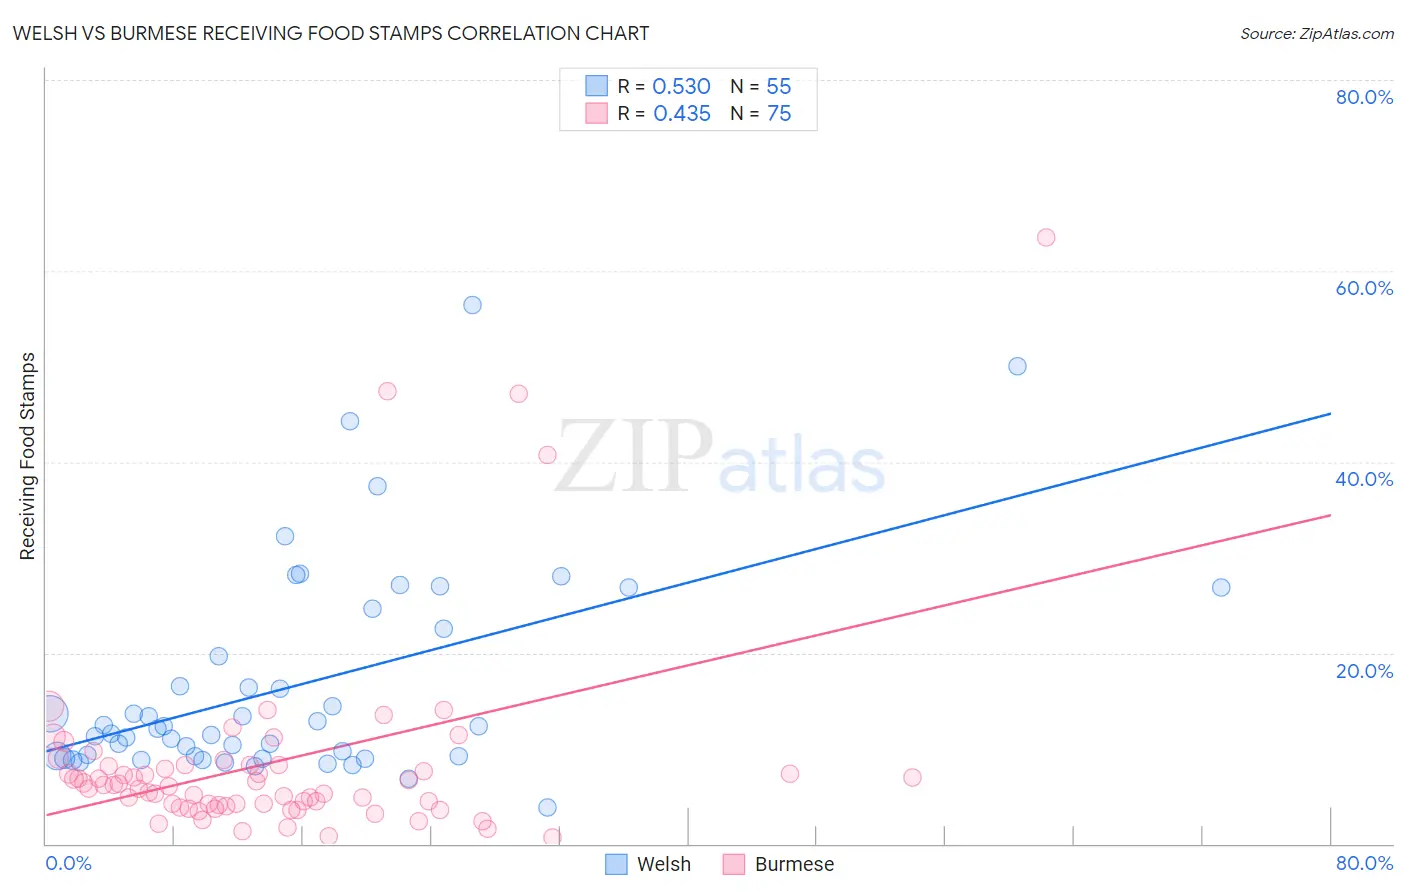
Welsh vs Burmese Receiving Food Stamps Correlation Chart
The statistical analysis conducted on geographies consisting of 526,059,303 people shows a substantial positive correlation between the proportion of Welsh and percentage of population receiving government assistance and/or food stamps in the United States with a correlation coefficient (R) of 0.530 and weighted average of 10.3%. Similarly, the statistical analysis conducted on geographies consisting of 463,413,617 people shows a moderate positive correlation between the proportion of Burmese and percentage of population receiving government assistance and/or food stamps in the United States with a correlation coefficient (R) of 0.435 and weighted average of 8.6%, a difference of 18.6%.
Receiving Food Stamps Correlation Summary
| Measurement | Welsh | Burmese |
| Minimum | 3.8% | 0.70% |
| Maximum | 56.4% | 63.5% |
| Range | 52.6% | 62.8% |
| Mean | 16.5% | 8.5% |
| Median | 12.1% | 6.1% |
| Interquartile 25% (IQ1) | 9.1% | 4.1% |
| Interquartile 75% (IQ3) | 22.5% | 8.3% |
| Interquartile Range (IQR) | 13.4% | 4.2% |
| Standard Deviation (Sample) | 11.2% | 10.5% |
| Standard Deviation (Population) | 11.1% | 10.4% |
Similar Demographics by Receiving Food Stamps
Demographics Similar to Welsh by Receiving Food Stamps
In terms of receiving food stamps, the demographic groups most similar to Welsh are Basque (10.3%, a difference of 0.050%), Immigrants from Greece (10.3%, a difference of 0.080%), Czechoslovakian (10.3%, a difference of 0.26%), Immigrants from Egypt (10.3%, a difference of 0.31%), and Serbian (10.3%, a difference of 0.49%).
| Demographics | Rating | Rank | Receiving Food Stamps |
| Immigrants | France | 98.3 /100 | #89 | Exceptional 10.1% |
| Finns | 97.9 /100 | #90 | Exceptional 10.2% |
| Jordanians | 97.9 /100 | #91 | Exceptional 10.2% |
| Irish | 97.9 /100 | #92 | Exceptional 10.2% |
| Belgians | 97.7 /100 | #93 | Exceptional 10.2% |
| Immigrants | Greece | 97.4 /100 | #94 | Exceptional 10.3% |
| Basques | 97.4 /100 | #95 | Exceptional 10.3% |
| Welsh | 97.3 /100 | #96 | Exceptional 10.3% |
| Czechoslovakians | 97.2 /100 | #97 | Exceptional 10.3% |
| Immigrants | Egypt | 97.1 /100 | #98 | Exceptional 10.3% |
| Serbians | 97.0 /100 | #99 | Exceptional 10.3% |
| Immigrants | Western Europe | 96.9 /100 | #100 | Exceptional 10.3% |
| Palestinians | 96.9 /100 | #101 | Exceptional 10.3% |
| Immigrants | Europe | 96.8 /100 | #102 | Exceptional 10.3% |
| Immigrants | Latvia | 96.8 /100 | #103 | Exceptional 10.3% |
Demographics Similar to Burmese by Receiving Food Stamps
In terms of receiving food stamps, the demographic groups most similar to Burmese are Immigrants from Korea (8.7%, a difference of 0.16%), Immigrants from South Central Asia (8.8%, a difference of 2.1%), Okinawan (8.9%, a difference of 2.5%), Cypriot (8.9%, a difference of 2.6%), and Bulgarian (8.9%, a difference of 2.8%).
| Demographics | Rating | Rank | Receiving Food Stamps |
| Immigrants | Taiwan | 100.0 /100 | #1 | Exceptional 7.3% |
| Immigrants | India | 100.0 /100 | #2 | Exceptional 7.4% |
| Filipinos | 100.0 /100 | #3 | Exceptional 7.4% |
| Iranians | 100.0 /100 | #4 | Exceptional 7.9% |
| Thais | 100.0 /100 | #5 | Exceptional 8.1% |
| Immigrants | Singapore | 100.0 /100 | #6 | Exceptional 8.3% |
| Immigrants | Iran | 100.0 /100 | #7 | Exceptional 8.3% |
| Burmese | 99.9 /100 | #8 | Exceptional 8.6% |
| Immigrants | Korea | 99.9 /100 | #9 | Exceptional 8.7% |
| Immigrants | South Central Asia | 99.9 /100 | #10 | Exceptional 8.8% |
| Okinawans | 99.9 /100 | #11 | Exceptional 8.9% |
| Cypriots | 99.9 /100 | #12 | Exceptional 8.9% |
| Bulgarians | 99.9 /100 | #13 | Exceptional 8.9% |
| Maltese | 99.9 /100 | #14 | Exceptional 8.9% |
| Norwegians | 99.9 /100 | #15 | Exceptional 9.0% |