Welsh vs Immigrants from Uganda Receiving Food Stamps
COMPARE
Welsh
Immigrants from Uganda
Receiving Food Stamps
Receiving Food Stamps Comparison
Welsh
Immigrants from Uganda
10.3%
RECEIVING FOOD STAMPS
97.3/ 100
METRIC RATING
96th/ 347
METRIC RANK
11.9%
RECEIVING FOOD STAMPS
40.3/ 100
METRIC RATING
183rd/ 347
METRIC RANK
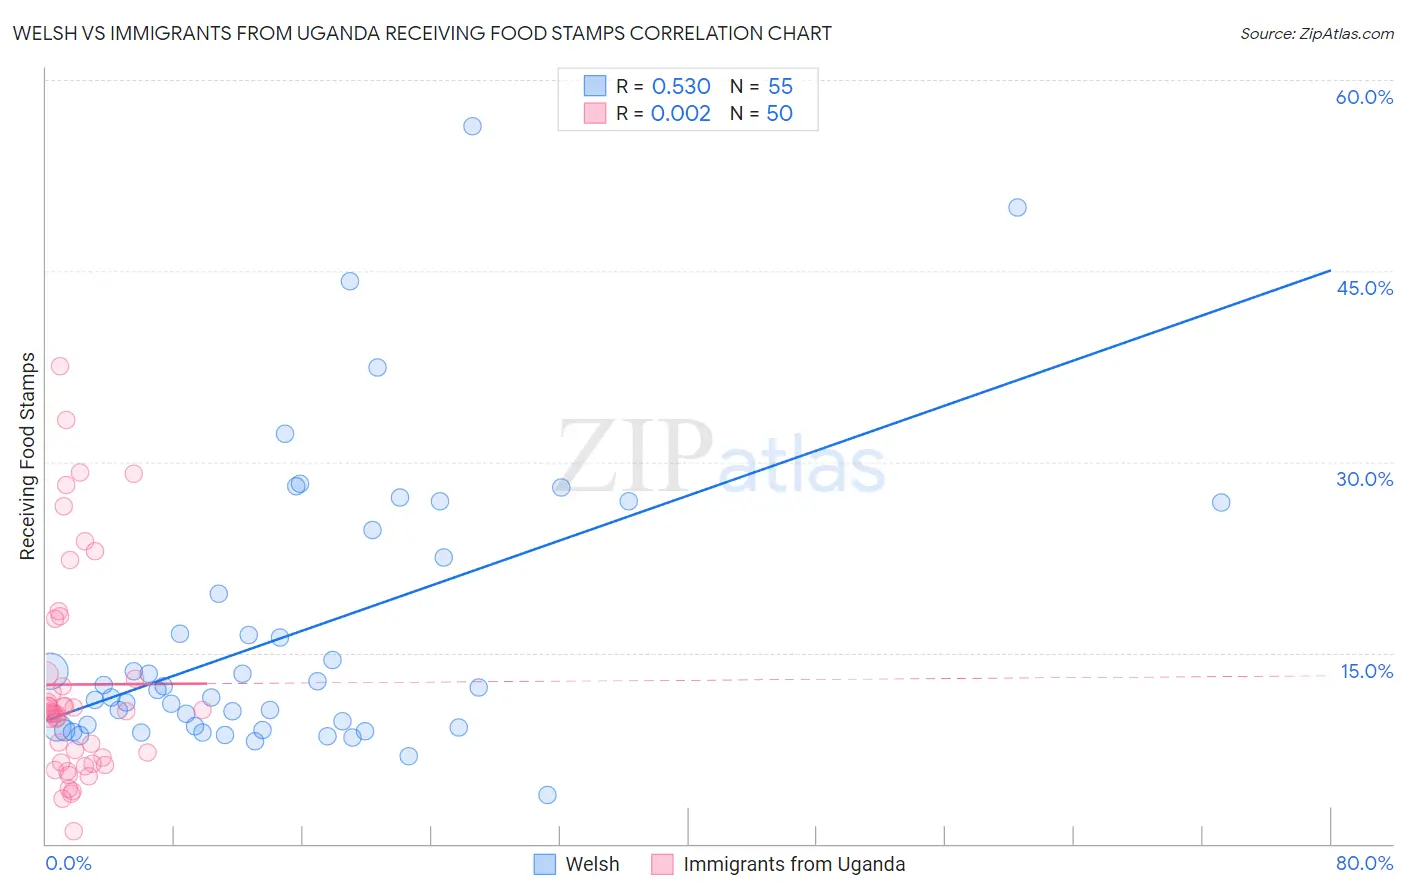
Welsh vs Immigrants from Uganda Receiving Food Stamps Correlation Chart
The statistical analysis conducted on geographies consisting of 526,059,303 people shows a substantial positive correlation between the proportion of Welsh and percentage of population receiving government assistance and/or food stamps in the United States with a correlation coefficient (R) of 0.530 and weighted average of 10.3%. Similarly, the statistical analysis conducted on geographies consisting of 125,947,478 people shows no correlation between the proportion of Immigrants from Uganda and percentage of population receiving government assistance and/or food stamps in the United States with a correlation coefficient (R) of 0.002 and weighted average of 11.9%, a difference of 16.0%.
Receiving Food Stamps Correlation Summary
| Measurement | Welsh | Immigrants from Uganda |
| Minimum | 3.8% | 1.0% |
| Maximum | 56.4% | 37.6% |
| Range | 52.6% | 36.6% |
| Mean | 16.5% | 12.5% |
| Median | 12.1% | 10.3% |
| Interquartile 25% (IQ1) | 9.1% | 6.4% |
| Interquartile 75% (IQ3) | 22.5% | 13.3% |
| Interquartile Range (IQR) | 13.4% | 6.9% |
| Standard Deviation (Sample) | 11.2% | 8.4% |
| Standard Deviation (Population) | 11.1% | 8.3% |
Similar Demographics by Receiving Food Stamps
Demographics Similar to Welsh by Receiving Food Stamps
In terms of receiving food stamps, the demographic groups most similar to Welsh are Basque (10.3%, a difference of 0.050%), Immigrants from Greece (10.3%, a difference of 0.080%), Czechoslovakian (10.3%, a difference of 0.26%), Immigrants from Egypt (10.3%, a difference of 0.31%), and Serbian (10.3%, a difference of 0.49%).
| Demographics | Rating | Rank | Receiving Food Stamps |
| Immigrants | France | 98.3 /100 | #89 | Exceptional 10.1% |
| Finns | 97.9 /100 | #90 | Exceptional 10.2% |
| Jordanians | 97.9 /100 | #91 | Exceptional 10.2% |
| Irish | 97.9 /100 | #92 | Exceptional 10.2% |
| Belgians | 97.7 /100 | #93 | Exceptional 10.2% |
| Immigrants | Greece | 97.4 /100 | #94 | Exceptional 10.3% |
| Basques | 97.4 /100 | #95 | Exceptional 10.3% |
| Welsh | 97.3 /100 | #96 | Exceptional 10.3% |
| Czechoslovakians | 97.2 /100 | #97 | Exceptional 10.3% |
| Immigrants | Egypt | 97.1 /100 | #98 | Exceptional 10.3% |
| Serbians | 97.0 /100 | #99 | Exceptional 10.3% |
| Immigrants | Western Europe | 96.9 /100 | #100 | Exceptional 10.3% |
| Palestinians | 96.9 /100 | #101 | Exceptional 10.3% |
| Immigrants | Europe | 96.8 /100 | #102 | Exceptional 10.3% |
| Immigrants | Latvia | 96.8 /100 | #103 | Exceptional 10.3% |
Demographics Similar to Immigrants from Uganda by Receiving Food Stamps
In terms of receiving food stamps, the demographic groups most similar to Immigrants from Uganda are Immigrants from Morocco (11.9%, a difference of 0.060%), Spaniard (11.9%, a difference of 0.080%), South American Indian (11.9%, a difference of 0.20%), Immigrants from Iraq (12.0%, a difference of 0.46%), and Spanish (12.0%, a difference of 0.50%).
| Demographics | Rating | Rank | Receiving Food Stamps |
| Peruvians | 49.3 /100 | #176 | Average 11.7% |
| Immigrants | Ukraine | 48.4 /100 | #177 | Average 11.8% |
| German Russians | 48.1 /100 | #178 | Average 11.8% |
| Immigrants | Kenya | 46.4 /100 | #179 | Average 11.8% |
| Uruguayans | 44.8 /100 | #180 | Average 11.8% |
| South American Indians | 41.7 /100 | #181 | Average 11.9% |
| Immigrants | Morocco | 40.7 /100 | #182 | Average 11.9% |
| Immigrants | Uganda | 40.3 /100 | #183 | Average 11.9% |
| Spaniards | 39.8 /100 | #184 | Fair 11.9% |
| Immigrants | Iraq | 37.1 /100 | #185 | Fair 12.0% |
| Spanish | 36.9 /100 | #186 | Fair 12.0% |
| Albanians | 35.4 /100 | #187 | Fair 12.0% |
| Sudanese | 33.4 /100 | #188 | Fair 12.0% |
| Immigrants | Cameroon | 32.5 /100 | #189 | Fair 12.0% |
| Immigrants | Peru | 32.2 /100 | #190 | Fair 12.0% |