Honduran vs Burmese Receiving Food Stamps
COMPARE
Honduran
Burmese
Receiving Food Stamps
Receiving Food Stamps Comparison
Hondurans
Burmese
15.5%
RECEIVING FOOD STAMPS
0.0/ 100
METRIC RATING
291st/ 347
METRIC RANK
8.6%
RECEIVING FOOD STAMPS
99.9/ 100
METRIC RATING
8th/ 347
METRIC RANK
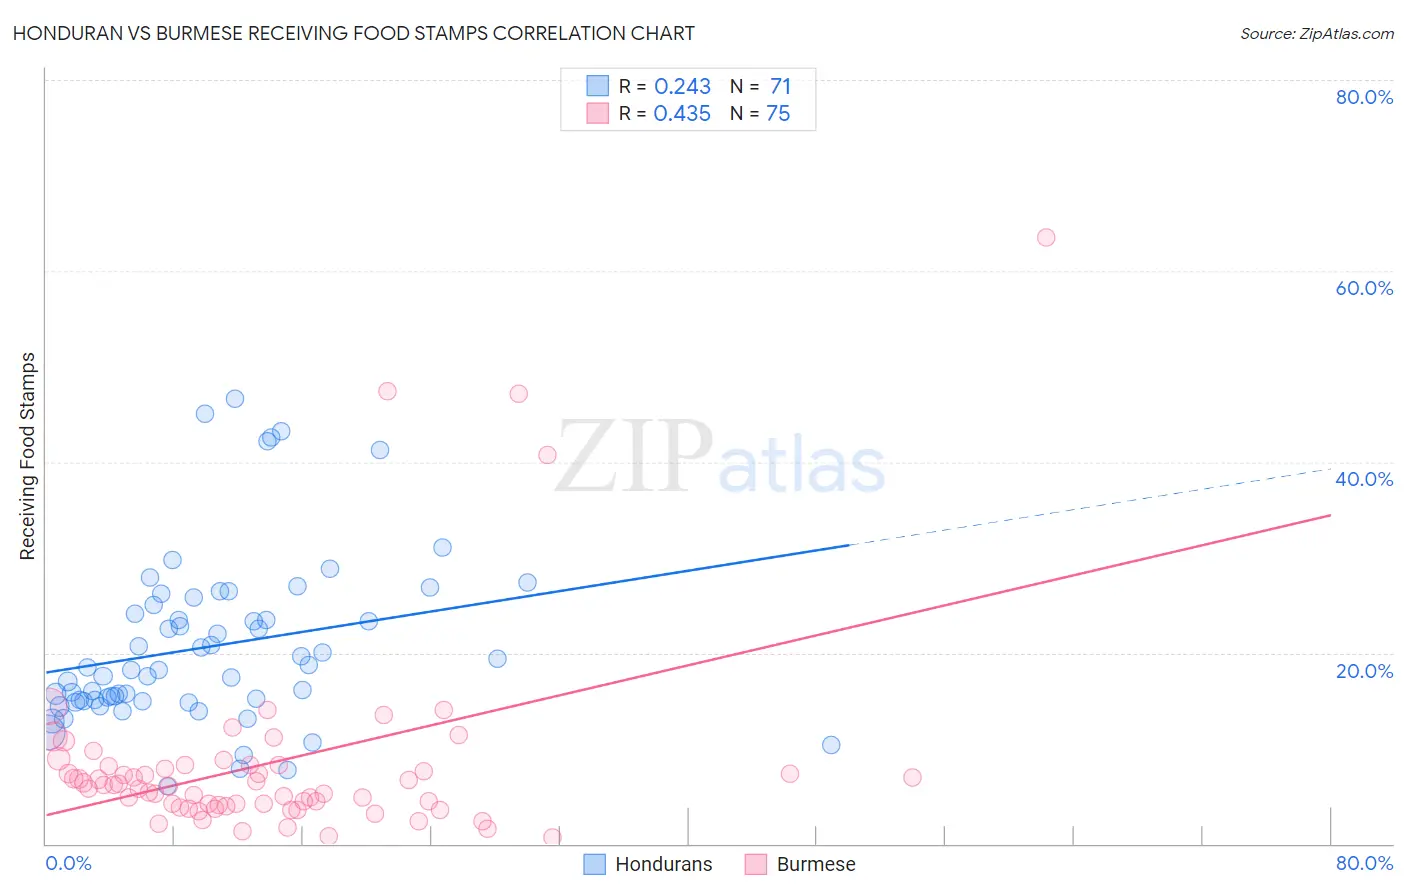
Honduran vs Burmese Receiving Food Stamps Correlation Chart
The statistical analysis conducted on geographies consisting of 357,240,438 people shows a weak positive correlation between the proportion of Hondurans and percentage of population receiving government assistance and/or food stamps in the United States with a correlation coefficient (R) of 0.243 and weighted average of 15.5%. Similarly, the statistical analysis conducted on geographies consisting of 463,413,617 people shows a moderate positive correlation between the proportion of Burmese and percentage of population receiving government assistance and/or food stamps in the United States with a correlation coefficient (R) of 0.435 and weighted average of 8.6%, a difference of 79.7%.
Receiving Food Stamps Correlation Summary
| Measurement | Honduran | Burmese |
| Minimum | 6.1% | 0.70% |
| Maximum | 46.6% | 63.5% |
| Range | 40.5% | 62.8% |
| Mean | 20.7% | 8.5% |
| Median | 18.2% | 6.1% |
| Interquartile 25% (IQ1) | 14.9% | 4.1% |
| Interquartile 75% (IQ3) | 25.0% | 8.3% |
| Interquartile Range (IQR) | 10.0% | 4.2% |
| Standard Deviation (Sample) | 8.9% | 10.5% |
| Standard Deviation (Population) | 8.9% | 10.4% |
Similar Demographics by Receiving Food Stamps
Demographics Similar to Hondurans by Receiving Food Stamps
In terms of receiving food stamps, the demographic groups most similar to Hondurans are Alaska Native (15.6%, a difference of 0.44%), Vietnamese (15.7%, a difference of 0.74%), Immigrants from Latin America (15.7%, a difference of 0.85%), Senegalese (15.4%, a difference of 1.0%), and Immigrants from Honduras (15.7%, a difference of 1.2%).
| Demographics | Rating | Rank | Receiving Food Stamps |
| Immigrants | Ecuador | 0.0 /100 | #284 | Tragic 15.0% |
| Immigrants | Liberia | 0.0 /100 | #285 | Tragic 15.1% |
| Africans | 0.0 /100 | #286 | Tragic 15.1% |
| Immigrants | Mexico | 0.0 /100 | #287 | Tragic 15.2% |
| Immigrants | Belize | 0.0 /100 | #288 | Tragic 15.2% |
| Immigrants | Senegal | 0.0 /100 | #289 | Tragic 15.3% |
| Senegalese | 0.0 /100 | #290 | Tragic 15.4% |
| Hondurans | 0.0 /100 | #291 | Tragic 15.5% |
| Alaska Natives | 0.0 /100 | #292 | Tragic 15.6% |
| Vietnamese | 0.0 /100 | #293 | Tragic 15.7% |
| Immigrants | Latin America | 0.0 /100 | #294 | Tragic 15.7% |
| Immigrants | Honduras | 0.0 /100 | #295 | Tragic 15.7% |
| Tsimshian | 0.0 /100 | #296 | Tragic 15.7% |
| Immigrants | Bahamas | 0.0 /100 | #297 | Tragic 15.8% |
| Immigrants | Trinidad and Tobago | 0.0 /100 | #298 | Tragic 15.8% |
Demographics Similar to Burmese by Receiving Food Stamps
In terms of receiving food stamps, the demographic groups most similar to Burmese are Immigrants from Korea (8.7%, a difference of 0.16%), Immigrants from South Central Asia (8.8%, a difference of 2.1%), Okinawan (8.9%, a difference of 2.5%), Cypriot (8.9%, a difference of 2.6%), and Bulgarian (8.9%, a difference of 2.8%).
| Demographics | Rating | Rank | Receiving Food Stamps |
| Immigrants | Taiwan | 100.0 /100 | #1 | Exceptional 7.3% |
| Immigrants | India | 100.0 /100 | #2 | Exceptional 7.4% |
| Filipinos | 100.0 /100 | #3 | Exceptional 7.4% |
| Iranians | 100.0 /100 | #4 | Exceptional 7.9% |
| Thais | 100.0 /100 | #5 | Exceptional 8.1% |
| Immigrants | Singapore | 100.0 /100 | #6 | Exceptional 8.3% |
| Immigrants | Iran | 100.0 /100 | #7 | Exceptional 8.3% |
| Burmese | 99.9 /100 | #8 | Exceptional 8.6% |
| Immigrants | Korea | 99.9 /100 | #9 | Exceptional 8.7% |
| Immigrants | South Central Asia | 99.9 /100 | #10 | Exceptional 8.8% |
| Okinawans | 99.9 /100 | #11 | Exceptional 8.9% |
| Cypriots | 99.9 /100 | #12 | Exceptional 8.9% |
| Bulgarians | 99.9 /100 | #13 | Exceptional 8.9% |
| Maltese | 99.9 /100 | #14 | Exceptional 8.9% |
| Norwegians | 99.9 /100 | #15 | Exceptional 9.0% |