Potawatomi vs Burmese Receiving Food Stamps
COMPARE
Potawatomi
Burmese
Receiving Food Stamps
Receiving Food Stamps Comparison
Potawatomi
Burmese
12.5%
RECEIVING FOOD STAMPS
14.6/ 100
METRIC RATING
208th/ 347
METRIC RANK
8.6%
RECEIVING FOOD STAMPS
99.9/ 100
METRIC RATING
8th/ 347
METRIC RANK
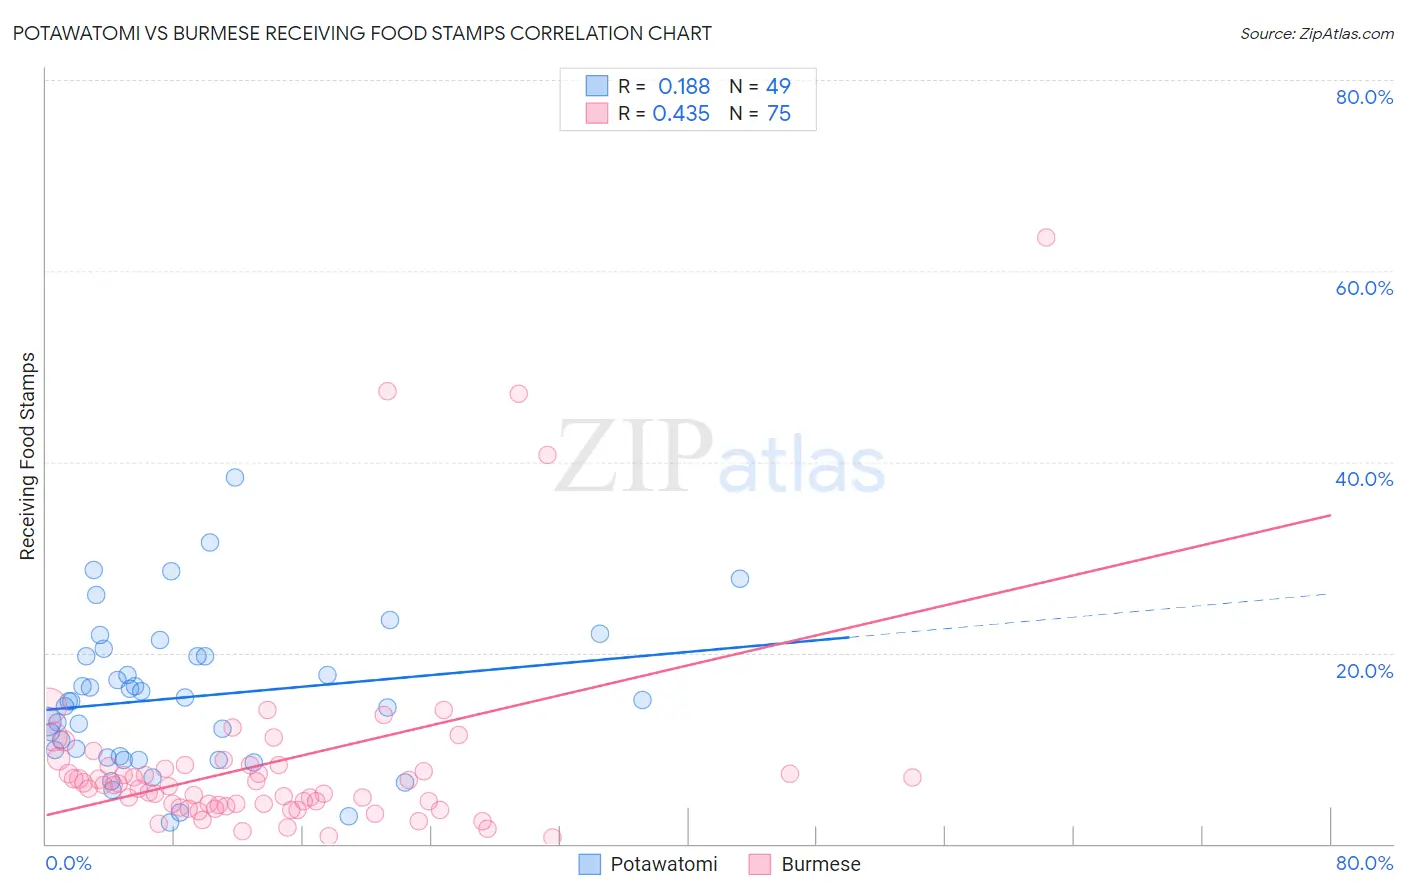
Potawatomi vs Burmese Receiving Food Stamps Correlation Chart
The statistical analysis conducted on geographies consisting of 117,725,542 people shows a poor positive correlation between the proportion of Potawatomi and percentage of population receiving government assistance and/or food stamps in the United States with a correlation coefficient (R) of 0.188 and weighted average of 12.5%. Similarly, the statistical analysis conducted on geographies consisting of 463,413,617 people shows a moderate positive correlation between the proportion of Burmese and percentage of population receiving government assistance and/or food stamps in the United States with a correlation coefficient (R) of 0.435 and weighted average of 8.6%, a difference of 44.1%.
Receiving Food Stamps Correlation Summary
| Measurement | Potawatomi | Burmese |
| Minimum | 2.2% | 0.70% |
| Maximum | 38.3% | 63.5% |
| Range | 36.1% | 62.8% |
| Mean | 15.3% | 8.5% |
| Median | 15.0% | 6.1% |
| Interquartile 25% (IQ1) | 9.1% | 4.1% |
| Interquartile 75% (IQ3) | 19.6% | 8.3% |
| Interquartile Range (IQR) | 10.6% | 4.2% |
| Standard Deviation (Sample) | 7.7% | 10.5% |
| Standard Deviation (Population) | 7.7% | 10.4% |
Similar Demographics by Receiving Food Stamps
Demographics Similar to Potawatomi by Receiving Food Stamps
In terms of receiving food stamps, the demographic groups most similar to Potawatomi are South American (12.4%, a difference of 0.36%), Immigrants from Sierra Leone (12.5%, a difference of 0.47%), Immigrants from Uruguay (12.5%, a difference of 0.50%), Immigrants from Thailand (12.4%, a difference of 0.62%), and Aleut (12.4%, a difference of 0.68%).
| Demographics | Rating | Rank | Receiving Food Stamps |
| Ugandans | 22.5 /100 | #201 | Fair 12.2% |
| Immigrants | Venezuela | 20.1 /100 | #202 | Fair 12.3% |
| Shoshone | 17.7 /100 | #203 | Poor 12.4% |
| Immigrants | Nonimmigrants | 17.6 /100 | #204 | Poor 12.4% |
| Aleuts | 17.3 /100 | #205 | Poor 12.4% |
| Immigrants | Thailand | 17.0 /100 | #206 | Poor 12.4% |
| South Americans | 16.0 /100 | #207 | Poor 12.4% |
| Potawatomi | 14.6 /100 | #208 | Poor 12.5% |
| Immigrants | Sierra Leone | 12.9 /100 | #209 | Poor 12.5% |
| Immigrants | Uruguay | 12.8 /100 | #210 | Poor 12.5% |
| Colombians | 10.2 /100 | #211 | Poor 12.6% |
| Malaysians | 8.5 /100 | #212 | Tragic 12.7% |
| Moroccans | 7.6 /100 | #213 | Tragic 12.8% |
| Immigrants | Africa | 7.6 /100 | #214 | Tragic 12.8% |
| Native Hawaiians | 6.7 /100 | #215 | Tragic 12.8% |
Demographics Similar to Burmese by Receiving Food Stamps
In terms of receiving food stamps, the demographic groups most similar to Burmese are Immigrants from Korea (8.7%, a difference of 0.16%), Immigrants from South Central Asia (8.8%, a difference of 2.1%), Okinawan (8.9%, a difference of 2.5%), Cypriot (8.9%, a difference of 2.6%), and Bulgarian (8.9%, a difference of 2.8%).
| Demographics | Rating | Rank | Receiving Food Stamps |
| Immigrants | Taiwan | 100.0 /100 | #1 | Exceptional 7.3% |
| Immigrants | India | 100.0 /100 | #2 | Exceptional 7.4% |
| Filipinos | 100.0 /100 | #3 | Exceptional 7.4% |
| Iranians | 100.0 /100 | #4 | Exceptional 7.9% |
| Thais | 100.0 /100 | #5 | Exceptional 8.1% |
| Immigrants | Singapore | 100.0 /100 | #6 | Exceptional 8.3% |
| Immigrants | Iran | 100.0 /100 | #7 | Exceptional 8.3% |
| Burmese | 99.9 /100 | #8 | Exceptional 8.6% |
| Immigrants | Korea | 99.9 /100 | #9 | Exceptional 8.7% |
| Immigrants | South Central Asia | 99.9 /100 | #10 | Exceptional 8.8% |
| Okinawans | 99.9 /100 | #11 | Exceptional 8.9% |
| Cypriots | 99.9 /100 | #12 | Exceptional 8.9% |
| Bulgarians | 99.9 /100 | #13 | Exceptional 8.9% |
| Maltese | 99.9 /100 | #14 | Exceptional 8.9% |
| Norwegians | 99.9 /100 | #15 | Exceptional 9.0% |