Vietnamese vs Immigrants from Cambodia Single Female Poverty
COMPARE
Vietnamese
Immigrants from Cambodia
Single Female Poverty
Single Female Poverty Comparison
Vietnamese
Immigrants from Cambodia
22.0%
SINGLE FEMALE POVERTY
4.0/ 100
METRIC RATING
237th/ 347
METRIC RANK
21.2%
SINGLE FEMALE POVERTY
38.2/ 100
METRIC RATING
185th/ 347
METRIC RANK
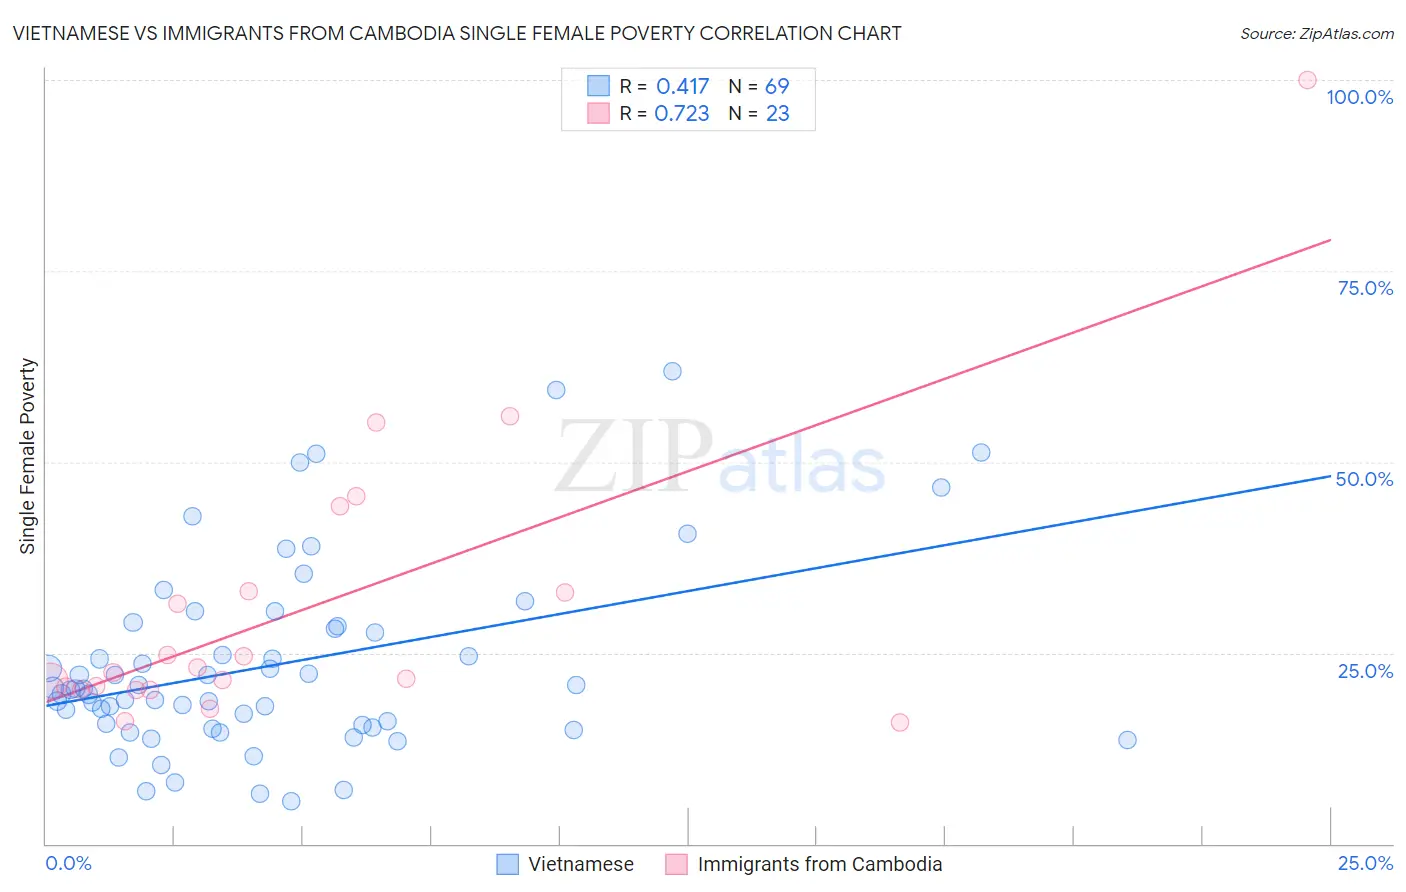
Vietnamese vs Immigrants from Cambodia Single Female Poverty Correlation Chart
The statistical analysis conducted on geographies consisting of 169,688,575 people shows a moderate positive correlation between the proportion of Vietnamese and poverty level among single females in the United States with a correlation coefficient (R) of 0.417 and weighted average of 22.0%. Similarly, the statistical analysis conducted on geographies consisting of 204,042,246 people shows a strong positive correlation between the proportion of Immigrants from Cambodia and poverty level among single females in the United States with a correlation coefficient (R) of 0.723 and weighted average of 21.2%, a difference of 4.2%.
Single Female Poverty Correlation Summary
| Measurement | Vietnamese | Immigrants from Cambodia |
| Minimum | 5.6% | 15.9% |
| Maximum | 61.9% | 100.0% |
| Range | 56.4% | 84.1% |
| Mean | 23.4% | 30.8% |
| Median | 20.3% | 22.4% |
| Interquartile 25% (IQ1) | 15.4% | 20.2% |
| Interquartile 75% (IQ3) | 28.3% | 33.1% |
| Interquartile Range (IQR) | 12.9% | 12.9% |
| Standard Deviation (Sample) | 12.3% | 19.1% |
| Standard Deviation (Population) | 12.3% | 18.7% |
Similar Demographics by Single Female Poverty
Demographics Similar to Vietnamese by Single Female Poverty
In terms of single female poverty, the demographic groups most similar to Vietnamese are Immigrants from Ecuador (22.0%, a difference of 0.070%), Dutch (22.0%, a difference of 0.23%), Spaniard (22.0%, a difference of 0.25%), Spanish (22.0%, a difference of 0.25%), and Immigrants from Thailand (22.0%, a difference of 0.35%).
| Demographics | Rating | Rank | Single Female Poverty |
| Immigrants | Western Africa | 5.3 /100 | #230 | Tragic 22.0% |
| Welsh | 5.0 /100 | #231 | Tragic 22.0% |
| Immigrants | Thailand | 5.0 /100 | #232 | Tragic 22.0% |
| Spaniards | 4.7 /100 | #233 | Tragic 22.0% |
| Spanish | 4.7 /100 | #234 | Tragic 22.0% |
| Dutch | 4.6 /100 | #235 | Tragic 22.0% |
| Immigrants | Ecuador | 4.2 /100 | #236 | Tragic 22.0% |
| Vietnamese | 4.0 /100 | #237 | Tragic 22.0% |
| French Canadians | 2.8 /100 | #238 | Tragic 22.2% |
| Malaysians | 2.8 /100 | #239 | Tragic 22.2% |
| French | 2.3 /100 | #240 | Tragic 22.2% |
| Cape Verdeans | 2.1 /100 | #241 | Tragic 22.3% |
| Bermudans | 2.0 /100 | #242 | Tragic 22.3% |
| West Indians | 1.9 /100 | #243 | Tragic 22.3% |
| Immigrants | Middle Africa | 1.9 /100 | #244 | Tragic 22.3% |
Demographics Similar to Immigrants from Cambodia by Single Female Poverty
In terms of single female poverty, the demographic groups most similar to Immigrants from Cambodia are Hawaiian (21.2%, a difference of 0.040%), Hungarian (21.1%, a difference of 0.090%), Slovak (21.1%, a difference of 0.10%), Immigrants from Nigeria (21.2%, a difference of 0.10%), and Slavic (21.1%, a difference of 0.15%).
| Demographics | Rating | Rank | Single Female Poverty |
| Immigrants | Bosnia and Herzegovina | 44.9 /100 | #178 | Average 21.1% |
| British | 42.9 /100 | #179 | Average 21.1% |
| Spanish American Indians | 42.5 /100 | #180 | Average 21.1% |
| Europeans | 42.3 /100 | #181 | Average 21.1% |
| Slavs | 40.5 /100 | #182 | Average 21.1% |
| Slovaks | 39.7 /100 | #183 | Fair 21.1% |
| Hungarians | 39.6 /100 | #184 | Fair 21.1% |
| Immigrants | Cambodia | 38.2 /100 | #185 | Fair 21.2% |
| Hawaiians | 37.7 /100 | #186 | Fair 21.2% |
| Immigrants | Nigeria | 36.8 /100 | #187 | Fair 21.2% |
| Yugoslavians | 35.4 /100 | #188 | Fair 21.2% |
| Immigrants | Cuba | 35.3 /100 | #189 | Fair 21.2% |
| Trinidadians and Tobagonians | 35.2 /100 | #190 | Fair 21.2% |
| Immigrants | Germany | 31.1 /100 | #191 | Fair 21.3% |
| Immigrants | Jamaica | 30.5 /100 | #192 | Fair 21.3% |