Vietnamese vs Immigrants from Cambodia Child Poverty Under the Age of 5
COMPARE
Vietnamese
Immigrants from Cambodia
Child Poverty Under the Age of 5
Child Poverty Under the Age of 5 Comparison
Vietnamese
Immigrants from Cambodia
19.5%
CHILD POVERTY UNDER THE AGE OF 5
0.6/ 100
METRIC RATING
239th/ 347
METRIC RANK
18.1%
CHILD POVERTY UNDER THE AGE OF 5
13.7/ 100
METRIC RATING
203rd/ 347
METRIC RANK
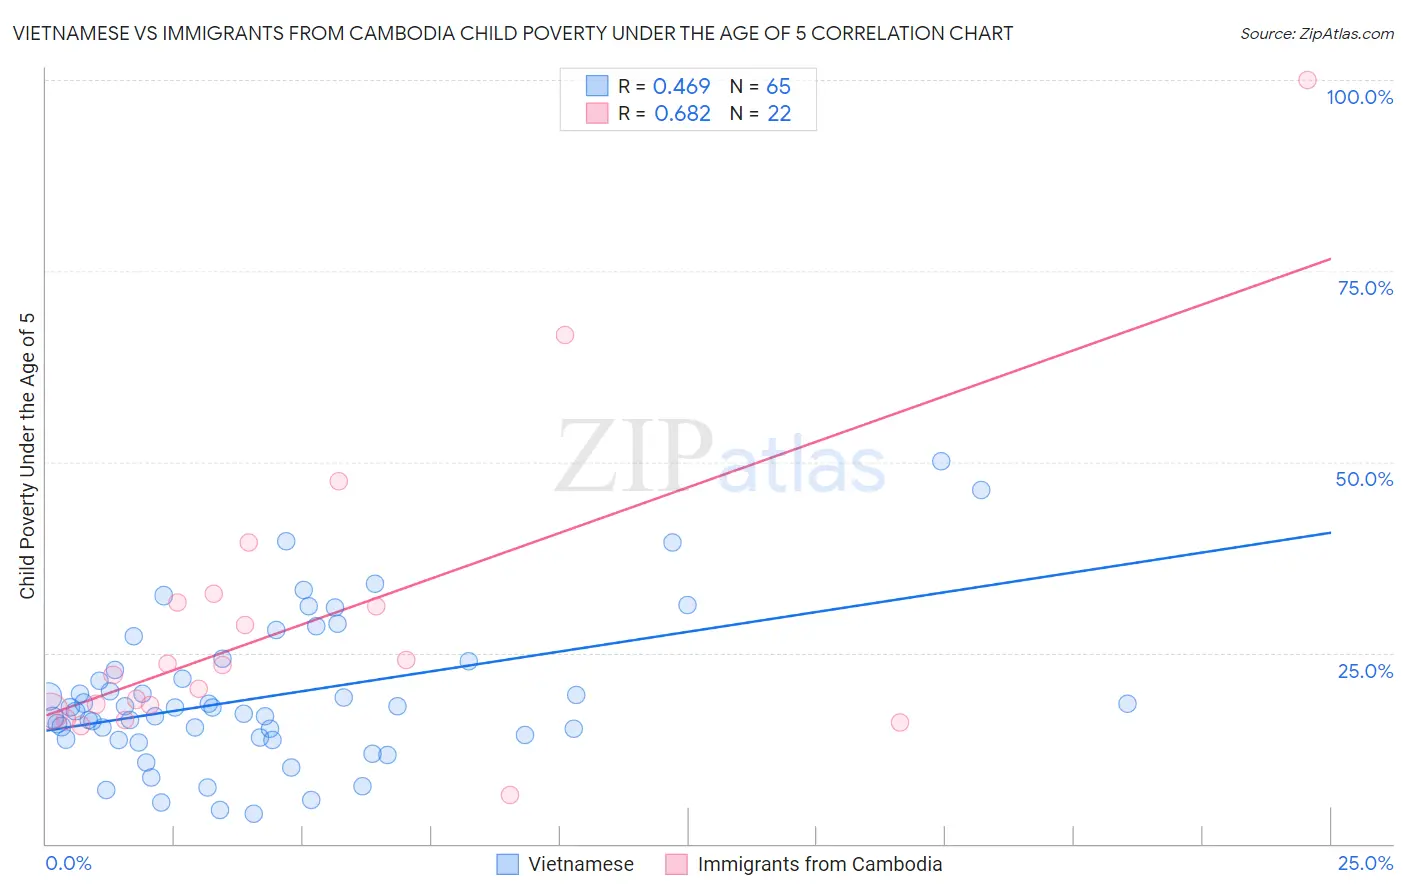
Vietnamese vs Immigrants from Cambodia Child Poverty Under the Age of 5 Correlation Chart
The statistical analysis conducted on geographies consisting of 167,363,305 people shows a moderate positive correlation between the proportion of Vietnamese and poverty level among children under the age of 5 in the United States with a correlation coefficient (R) of 0.469 and weighted average of 19.5%. Similarly, the statistical analysis conducted on geographies consisting of 201,266,142 people shows a significant positive correlation between the proportion of Immigrants from Cambodia and poverty level among children under the age of 5 in the United States with a correlation coefficient (R) of 0.682 and weighted average of 18.1%, a difference of 8.1%.
Child Poverty Under the Age of 5 Correlation Summary
| Measurement | Vietnamese | Immigrants from Cambodia |
| Minimum | 3.9% | 6.3% |
| Maximum | 50.1% | 100.0% |
| Range | 46.2% | 93.7% |
| Mean | 19.4% | 28.8% |
| Median | 17.9% | 22.7% |
| Interquartile 25% (IQ1) | 13.8% | 17.4% |
| Interquartile 75% (IQ3) | 23.3% | 31.6% |
| Interquartile Range (IQR) | 9.5% | 14.2% |
| Standard Deviation (Sample) | 9.6% | 20.5% |
| Standard Deviation (Population) | 9.5% | 20.0% |
Similar Demographics by Child Poverty Under the Age of 5
Demographics Similar to Vietnamese by Child Poverty Under the Age of 5
In terms of child poverty under the age of 5, the demographic groups most similar to Vietnamese are Salvadoran (19.5%, a difference of 0.020%), Immigrants from Cabo Verde (19.5%, a difference of 0.040%), Immigrants from Ecuador (19.6%, a difference of 0.37%), Alaska Native (19.6%, a difference of 0.44%), and Immigrants from Guyana (19.6%, a difference of 0.55%).
| Demographics | Rating | Rank | Child Poverty Under the Age of 5 |
| Trinidadians and Tobagonians | 0.9 /100 | #232 | Tragic 19.3% |
| Sudanese | 0.9 /100 | #233 | Tragic 19.3% |
| Immigrants | Micronesia | 0.9 /100 | #234 | Tragic 19.4% |
| Immigrants | Laos | 0.8 /100 | #235 | Tragic 19.4% |
| Immigrants | Trinidad and Tobago | 0.8 /100 | #236 | Tragic 19.4% |
| Immigrants | Cabo Verde | 0.6 /100 | #237 | Tragic 19.5% |
| Salvadorans | 0.6 /100 | #238 | Tragic 19.5% |
| Vietnamese | 0.6 /100 | #239 | Tragic 19.5% |
| Immigrants | Ecuador | 0.5 /100 | #240 | Tragic 19.6% |
| Alaska Natives | 0.5 /100 | #241 | Tragic 19.6% |
| Immigrants | Guyana | 0.5 /100 | #242 | Tragic 19.6% |
| Osage | 0.5 /100 | #243 | Tragic 19.6% |
| Immigrants | Ghana | 0.5 /100 | #244 | Tragic 19.6% |
| Immigrants | Western Africa | 0.4 /100 | #245 | Tragic 19.7% |
| Cree | 0.4 /100 | #246 | Tragic 19.7% |
Demographics Similar to Immigrants from Cambodia by Child Poverty Under the Age of 5
In terms of child poverty under the age of 5, the demographic groups most similar to Immigrants from Cambodia are Japanese (18.1%, a difference of 0.020%), Ugandan (18.0%, a difference of 0.040%), Iraqi (18.0%, a difference of 0.050%), Immigrants from Eastern Africa (18.1%, a difference of 0.050%), and Spaniard (18.1%, a difference of 0.19%).
| Demographics | Rating | Rank | Child Poverty Under the Age of 5 |
| Immigrants | Portugal | 22.2 /100 | #196 | Fair 17.8% |
| Immigrants | Kenya | 20.0 /100 | #197 | Fair 17.9% |
| Celtics | 18.3 /100 | #198 | Poor 17.9% |
| Hungarians | 18.3 /100 | #199 | Poor 17.9% |
| Iraqis | 14.0 /100 | #200 | Poor 18.0% |
| Ugandans | 13.9 /100 | #201 | Poor 18.0% |
| Japanese | 13.8 /100 | #202 | Poor 18.1% |
| Immigrants | Cambodia | 13.7 /100 | #203 | Poor 18.1% |
| Immigrants | Eastern Africa | 13.4 /100 | #204 | Poor 18.1% |
| Spaniards | 12.8 /100 | #205 | Poor 18.1% |
| Whites/Caucasians | 12.6 /100 | #206 | Poor 18.1% |
| Immigrants | Immigrants | 9.9 /100 | #207 | Tragic 18.2% |
| Scotch-Irish | 9.8 /100 | #208 | Tragic 18.2% |
| Spanish | 9.8 /100 | #209 | Tragic 18.2% |
| Panamanians | 9.7 /100 | #210 | Tragic 18.2% |