Vietnamese vs Cheyenne Single Mother Households
COMPARE
Vietnamese
Cheyenne
Single Mother Households
Single Mother Households Comparison
Vietnamese
Cheyenne
6.7%
SINGLE MOTHER HOUSEHOLDS
11.3/ 100
METRIC RATING
208th/ 347
METRIC RANK
8.1%
SINGLE MOTHER HOUSEHOLDS
0.0/ 100
METRIC RATING
309th/ 347
METRIC RANK
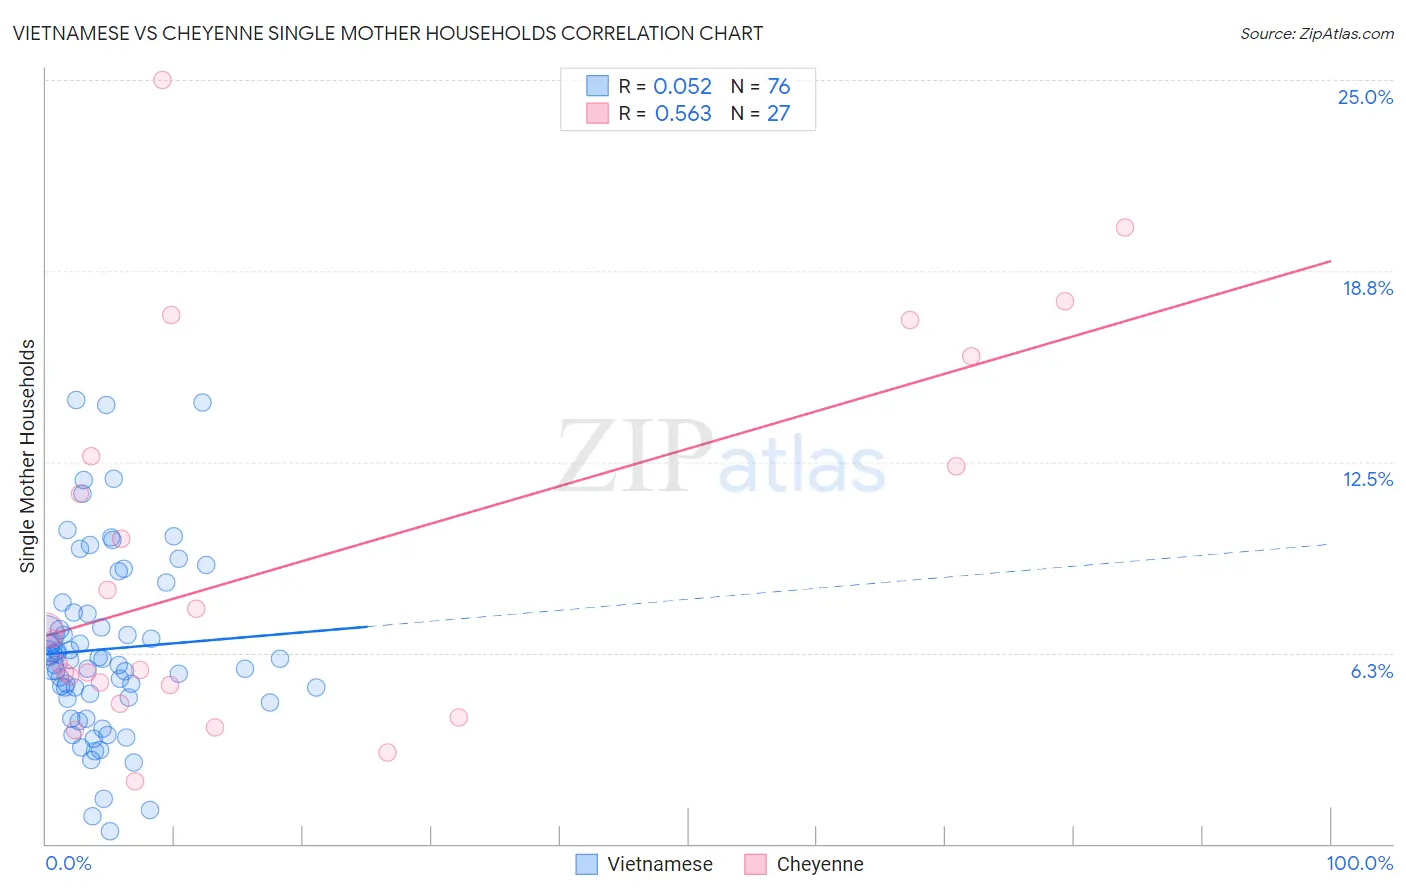
Vietnamese vs Cheyenne Single Mother Households Correlation Chart
The statistical analysis conducted on geographies consisting of 170,499,454 people shows a slight positive correlation between the proportion of Vietnamese and percentage of single mother households in the United States with a correlation coefficient (R) of 0.052 and weighted average of 6.7%. Similarly, the statistical analysis conducted on geographies consisting of 80,615,278 people shows a substantial positive correlation between the proportion of Cheyenne and percentage of single mother households in the United States with a correlation coefficient (R) of 0.563 and weighted average of 8.1%, a difference of 21.3%.
Single Mother Households Correlation Summary
| Measurement | Vietnamese | Cheyenne |
| Minimum | 0.40% | 2.1% |
| Maximum | 14.5% | 25.0% |
| Range | 14.1% | 22.9% |
| Mean | 6.4% | 9.2% |
| Median | 6.0% | 6.7% |
| Interquartile 25% (IQ1) | 4.8% | 5.2% |
| Interquartile 75% (IQ3) | 7.6% | 12.7% |
| Interquartile Range (IQR) | 2.8% | 7.5% |
| Standard Deviation (Sample) | 3.0% | 6.0% |
| Standard Deviation (Population) | 2.9% | 5.9% |
Similar Demographics by Single Mother Households
Demographics Similar to Vietnamese by Single Mother Households
In terms of single mother households, the demographic groups most similar to Vietnamese are German Russian (6.7%, a difference of 0.050%), Immigrants from South America (6.7%, a difference of 0.050%), Cree (6.7%, a difference of 0.14%), Immigrants from Fiji (6.7%, a difference of 0.15%), and Immigrants from Peru (6.7%, a difference of 0.17%).
| Demographics | Rating | Rank | Single Mother Households |
| Venezuelans | 12.9 /100 | #201 | Poor 6.6% |
| Guamanians/Chamorros | 12.4 /100 | #202 | Poor 6.6% |
| Immigrants | Peru | 12.0 /100 | #203 | Poor 6.7% |
| Immigrants | Fiji | 11.9 /100 | #204 | Poor 6.7% |
| Cree | 11.9 /100 | #205 | Poor 6.7% |
| German Russians | 11.5 /100 | #206 | Poor 6.7% |
| Immigrants | South America | 11.5 /100 | #207 | Poor 6.7% |
| Vietnamese | 11.3 /100 | #208 | Poor 6.7% |
| Immigrants | Colombia | 10.5 /100 | #209 | Poor 6.7% |
| Immigrants | Nonimmigrants | 10.4 /100 | #210 | Poor 6.7% |
| Immigrants | Venezuela | 8.5 /100 | #211 | Tragic 6.7% |
| Immigrants | Eritrea | 8.4 /100 | #212 | Tragic 6.7% |
| Immigrants | Costa Rica | 8.2 /100 | #213 | Tragic 6.7% |
| Immigrants | Uruguay | 7.9 /100 | #214 | Tragic 6.7% |
| Shoshone | 5.7 /100 | #215 | Tragic 6.8% |
Demographics Similar to Cheyenne by Single Mother Households
In terms of single mother households, the demographic groups most similar to Cheyenne are Honduran (8.1%, a difference of 0.050%), Immigrants from Congo (8.1%, a difference of 0.35%), Immigrants from Central America (8.1%, a difference of 0.44%), Immigrants from St. Vincent and the Grenadines (8.0%, a difference of 0.46%), and Bangladeshi (8.1%, a difference of 0.64%).
| Demographics | Rating | Rank | Single Mother Households |
| Immigrants | Ghana | 0.0 /100 | #302 | Tragic 8.0% |
| Immigrants | Bahamas | 0.0 /100 | #303 | Tragic 8.0% |
| Natives/Alaskans | 0.0 /100 | #304 | Tragic 8.0% |
| Colville | 0.0 /100 | #305 | Tragic 8.0% |
| Immigrants | Barbados | 0.0 /100 | #306 | Tragic 8.0% |
| Immigrants | St. Vincent and the Grenadines | 0.0 /100 | #307 | Tragic 8.0% |
| Immigrants | Central America | 0.0 /100 | #308 | Tragic 8.1% |
| Cheyenne | 0.0 /100 | #309 | Tragic 8.1% |
| Hondurans | 0.0 /100 | #310 | Tragic 8.1% |
| Immigrants | Congo | 0.0 /100 | #311 | Tragic 8.1% |
| Bangladeshis | 0.0 /100 | #312 | Tragic 8.1% |
| Immigrants | Grenada | 0.0 /100 | #313 | Tragic 8.2% |
| Immigrants | Mexico | 0.0 /100 | #314 | Tragic 8.2% |
| Immigrants | Western Africa | 0.0 /100 | #315 | Tragic 8.2% |
| Africans | 0.0 /100 | #316 | Tragic 8.2% |