Ute vs Uruguayan Single Mother Poverty
COMPARE
Ute
Uruguayan
Single Mother Poverty
Single Mother Poverty Comparison
Ute
Uruguayans
35.7%
SINGLE MOTHER POVERTY
0.0/ 100
METRIC RATING
325th/ 347
METRIC RANK
28.3%
SINGLE MOTHER POVERTY
91.7/ 100
METRIC RATING
123rd/ 347
METRIC RANK
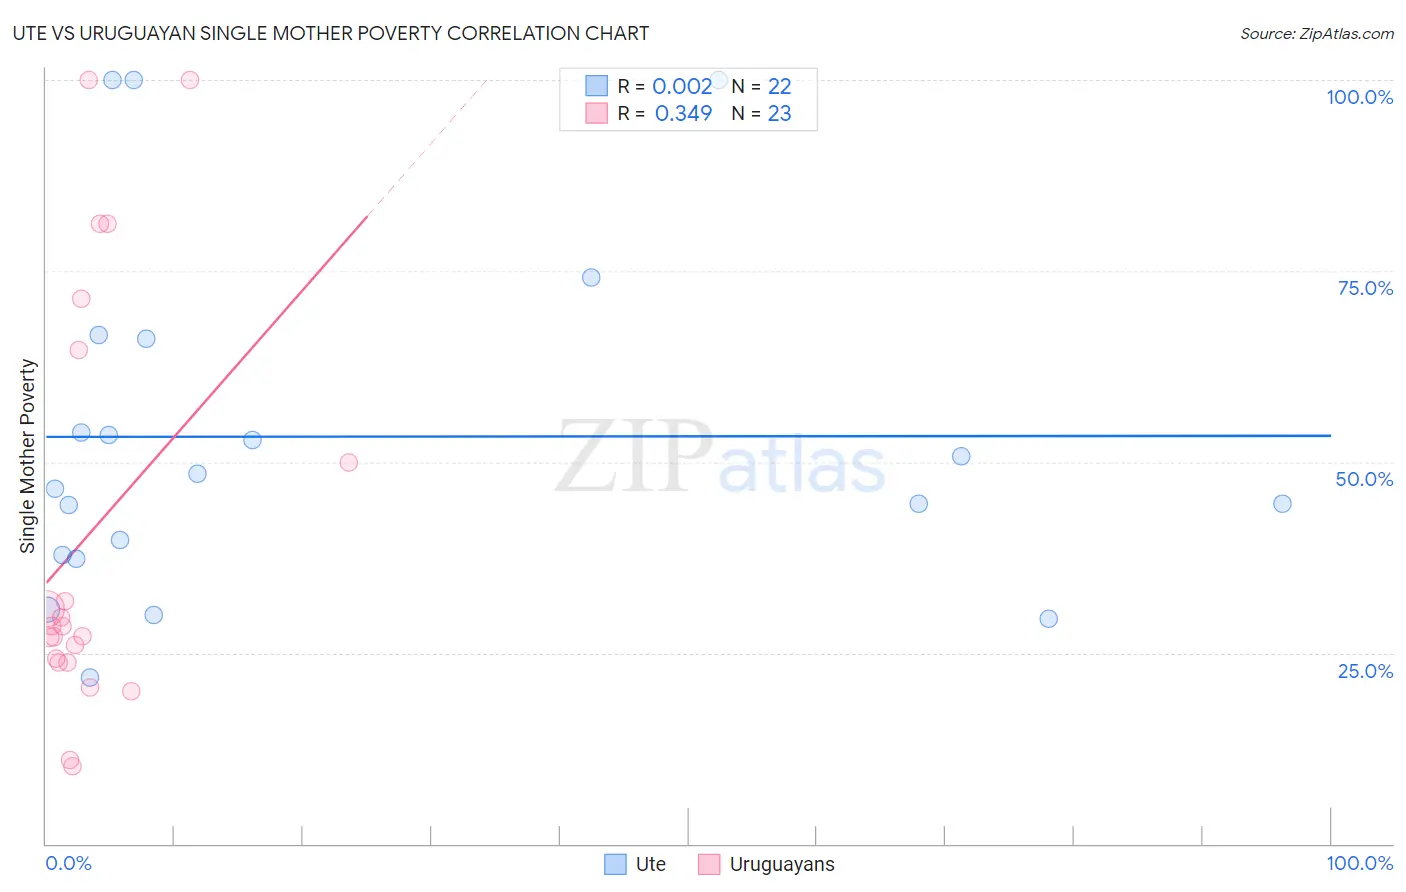
Ute vs Uruguayan Single Mother Poverty Correlation Chart
The statistical analysis conducted on geographies consisting of 55,474,720 people shows no correlation between the proportion of Ute and poverty level among single mothers in the United States with a correlation coefficient (R) of 0.002 and weighted average of 35.7%. Similarly, the statistical analysis conducted on geographies consisting of 142,981,701 people shows a mild positive correlation between the proportion of Uruguayans and poverty level among single mothers in the United States with a correlation coefficient (R) of 0.349 and weighted average of 28.3%, a difference of 26.1%.
Single Mother Poverty Correlation Summary
| Measurement | Ute | Uruguayan |
| Minimum | 21.7% | 10.2% |
| Maximum | 100.0% | 100.0% |
| Range | 78.3% | 89.8% |
| Mean | 53.3% | 40.8% |
| Median | 47.4% | 28.4% |
| Interquartile 25% (IQ1) | 37.9% | 23.7% |
| Interquartile 75% (IQ3) | 66.2% | 64.7% |
| Interquartile Range (IQR) | 28.3% | 40.9% |
| Standard Deviation (Sample) | 22.8% | 27.6% |
| Standard Deviation (Population) | 22.3% | 27.0% |
Similar Demographics by Single Mother Poverty
Demographics Similar to Ute by Single Mother Poverty
In terms of single mother poverty, the demographic groups most similar to Ute are Seminole (35.8%, a difference of 0.30%), Ottawa (35.5%, a difference of 0.48%), Kiowa (35.5%, a difference of 0.69%), Black/African American (35.2%, a difference of 1.4%), and Paiute (35.1%, a difference of 1.6%).
| Demographics | Rating | Rank | Single Mother Poverty |
| Immigrants | Honduras | 0.0 /100 | #318 | Tragic 34.7% |
| Chippewa | 0.0 /100 | #319 | Tragic 34.8% |
| Iroquois | 0.0 /100 | #320 | Tragic 34.8% |
| Paiute | 0.0 /100 | #321 | Tragic 35.1% |
| Blacks/African Americans | 0.0 /100 | #322 | Tragic 35.2% |
| Kiowa | 0.0 /100 | #323 | Tragic 35.5% |
| Ottawa | 0.0 /100 | #324 | Tragic 35.5% |
| Ute | 0.0 /100 | #325 | Tragic 35.7% |
| Seminole | 0.0 /100 | #326 | Tragic 35.8% |
| Yakama | 0.0 /100 | #327 | Tragic 36.4% |
| Choctaw | 0.0 /100 | #328 | Tragic 36.4% |
| Apache | 0.0 /100 | #329 | Tragic 36.6% |
| Natives/Alaskans | 0.0 /100 | #330 | Tragic 36.6% |
| Creek | 0.0 /100 | #331 | Tragic 36.7% |
| Dutch West Indians | 0.0 /100 | #332 | Tragic 36.8% |
Demographics Similar to Uruguayans by Single Mother Poverty
In terms of single mother poverty, the demographic groups most similar to Uruguayans are Immigrants from Switzerland (28.3%, a difference of 0.0%), Colombian (28.3%, a difference of 0.010%), Immigrants from Afghanistan (28.3%, a difference of 0.060%), Cypriot (28.3%, a difference of 0.10%), and Immigrants from Syria (28.3%, a difference of 0.11%).
| Demographics | Rating | Rank | Single Mother Poverty |
| Immigrants | Uganda | 92.5 /100 | #116 | Exceptional 28.3% |
| Australians | 92.5 /100 | #117 | Exceptional 28.3% |
| Brazilians | 92.4 /100 | #118 | Exceptional 28.3% |
| Immigrants | Syria | 92.4 /100 | #119 | Exceptional 28.3% |
| Cypriots | 92.3 /100 | #120 | Exceptional 28.3% |
| Immigrants | Afghanistan | 92.1 /100 | #121 | Exceptional 28.3% |
| Colombians | 91.8 /100 | #122 | Exceptional 28.3% |
| Uruguayans | 91.7 /100 | #123 | Exceptional 28.3% |
| Immigrants | Switzerland | 91.7 /100 | #124 | Exceptional 28.3% |
| Kenyans | 90.9 /100 | #125 | Exceptional 28.4% |
| Immigrants | Chile | 90.8 /100 | #126 | Exceptional 28.4% |
| Poles | 90.8 /100 | #127 | Exceptional 28.4% |
| Immigrants | England | 90.5 /100 | #128 | Exceptional 28.4% |
| South Americans | 90.4 /100 | #129 | Exceptional 28.4% |
| Norwegians | 90.4 /100 | #130 | Exceptional 28.4% |