Ute vs Cheyenne 8th Grade
COMPARE
Ute
Cheyenne
8th Grade
8th Grade Comparison
Ute
Cheyenne
95.8%
8TH GRADE
58.5/ 100
METRIC RATING
170th/ 347
METRIC RANK
96.1%
8TH GRADE
93.3/ 100
METRIC RATING
129th/ 347
METRIC RANK
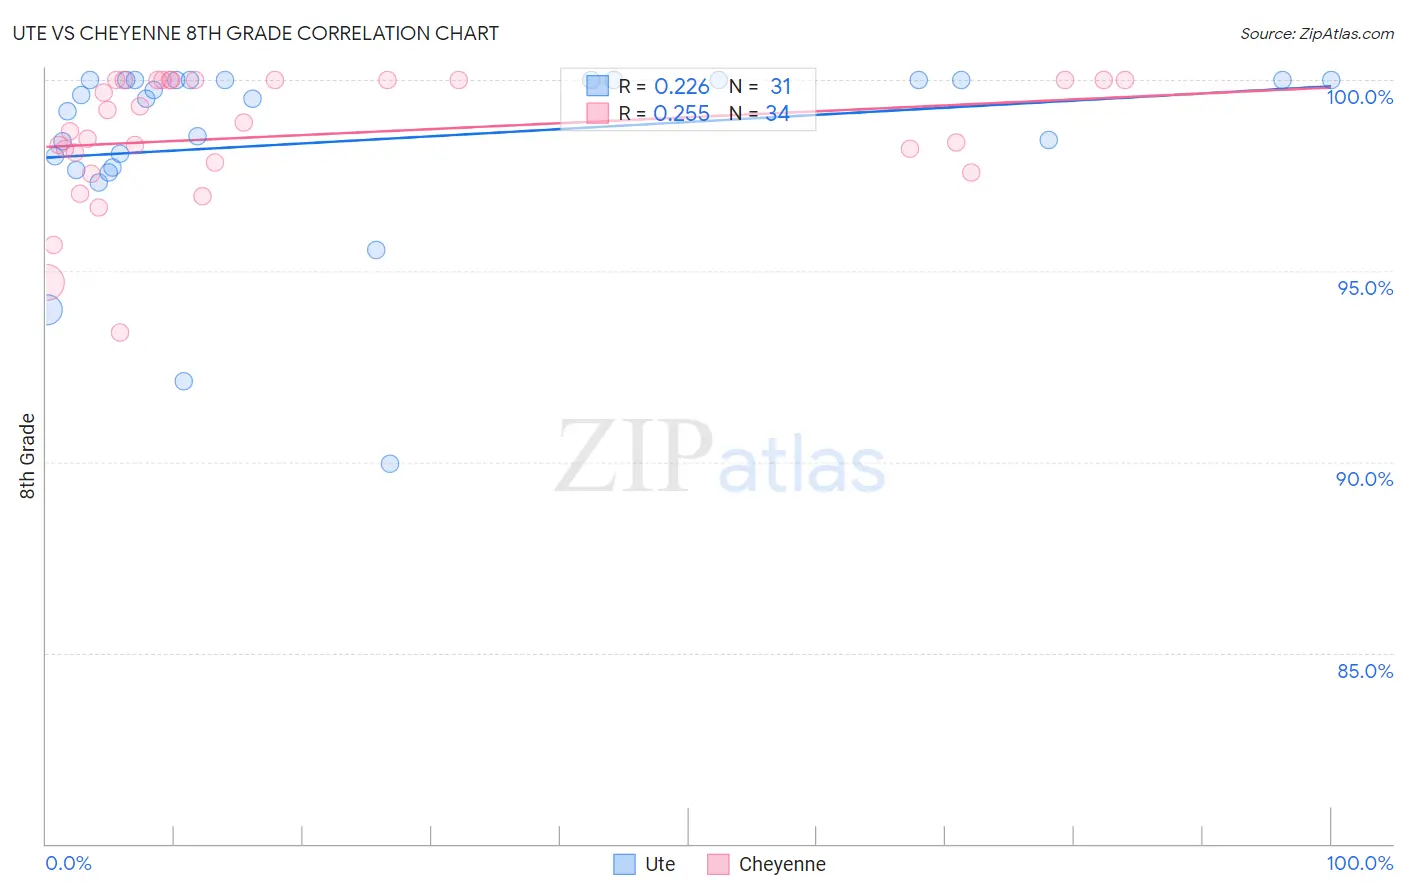
Ute vs Cheyenne 8th Grade Correlation Chart
The statistical analysis conducted on geographies consisting of 55,668,539 people shows a weak positive correlation between the proportion of Ute and percentage of population with at least 8th grade education in the United States with a correlation coefficient (R) of 0.226 and weighted average of 95.8%. Similarly, the statistical analysis conducted on geographies consisting of 80,719,411 people shows a weak positive correlation between the proportion of Cheyenne and percentage of population with at least 8th grade education in the United States with a correlation coefficient (R) of 0.255 and weighted average of 96.1%, a difference of 0.37%.
8th Grade Correlation Summary
| Measurement | Ute | Cheyenne |
| Minimum | 89.9% | 93.4% |
| Maximum | 100.0% | 100.0% |
| Range | 10.1% | 6.6% |
| Mean | 98.4% | 98.6% |
| Median | 99.5% | 98.8% |
| Interquartile 25% (IQ1) | 97.7% | 97.8% |
| Interquartile 75% (IQ3) | 100.0% | 100.0% |
| Interquartile Range (IQR) | 2.3% | 2.2% |
| Standard Deviation (Sample) | 2.5% | 1.7% |
| Standard Deviation (Population) | 2.4% | 1.6% |
Similar Demographics by 8th Grade
Demographics Similar to Ute by 8th Grade
In terms of 8th grade, the demographic groups most similar to Ute are Immigrants from Iran (95.8%, a difference of 0.0%), Egyptian (95.8%, a difference of 0.0%), Immigrants from Korea (95.8%, a difference of 0.0%), Spaniard (95.8%, a difference of 0.010%), and Immigrants from Ukraine (95.8%, a difference of 0.010%).
| Demographics | Rating | Rank | 8th Grade |
| Immigrants | Sri Lanka | 64.1 /100 | #163 | Good 95.8% |
| Immigrants | Italy | 63.5 /100 | #164 | Good 95.8% |
| Alsatians | 61.4 /100 | #165 | Good 95.8% |
| Immigrants | Poland | 61.1 /100 | #166 | Good 95.8% |
| Spaniards | 60.0 /100 | #167 | Good 95.8% |
| Immigrants | Ukraine | 59.5 /100 | #168 | Average 95.8% |
| Immigrants | Iran | 58.6 /100 | #169 | Average 95.8% |
| Ute | 58.5 /100 | #170 | Average 95.8% |
| Egyptians | 58.2 /100 | #171 | Average 95.8% |
| Immigrants | Korea | 57.9 /100 | #172 | Average 95.8% |
| Mongolians | 53.0 /100 | #173 | Average 95.8% |
| Chileans | 50.0 /100 | #174 | Average 95.7% |
| Immigrants | Albania | 49.6 /100 | #175 | Average 95.7% |
| Pakistanis | 48.8 /100 | #176 | Average 95.7% |
| Marshallese | 47.6 /100 | #177 | Average 95.7% |
Demographics Similar to Cheyenne by 8th Grade
In terms of 8th grade, the demographic groups most similar to Cheyenne are Immigrants from Bosnia and Herzegovina (96.2%, a difference of 0.010%), Immigrants from Romania (96.2%, a difference of 0.020%), Choctaw (96.2%, a difference of 0.020%), Immigrants from Serbia (96.2%, a difference of 0.020%), and Soviet Union (96.1%, a difference of 0.020%).
| Demographics | Rating | Rank | 8th Grade |
| Immigrants | Europe | 95.3 /100 | #122 | Exceptional 96.2% |
| Filipinos | 94.6 /100 | #123 | Exceptional 96.2% |
| Palestinians | 94.6 /100 | #124 | Exceptional 96.2% |
| Immigrants | Romania | 94.1 /100 | #125 | Exceptional 96.2% |
| Choctaw | 94.0 /100 | #126 | Exceptional 96.2% |
| Immigrants | Serbia | 94.0 /100 | #127 | Exceptional 96.2% |
| Immigrants | Bosnia and Herzegovina | 93.9 /100 | #128 | Exceptional 96.2% |
| Cheyenne | 93.3 /100 | #129 | Exceptional 96.1% |
| Soviet Union | 92.6 /100 | #130 | Exceptional 96.1% |
| Pueblo | 92.3 /100 | #131 | Exceptional 96.1% |
| Immigrants | Kuwait | 92.2 /100 | #132 | Exceptional 96.1% |
| Immigrants | Turkey | 91.7 /100 | #133 | Exceptional 96.1% |
| Immigrants | Hungary | 91.5 /100 | #134 | Exceptional 96.1% |
| Basques | 91.5 /100 | #135 | Exceptional 96.1% |
| Jordanians | 91.3 /100 | #136 | Exceptional 96.1% |