Syrian vs Paiute Male Poverty
COMPARE
Syrian
Paiute
Male Poverty
Male Poverty Comparison
Syrians
Paiute
10.9%
MALE POVERTY
71.4/ 100
METRIC RATING
146th/ 347
METRIC RANK
15.8%
MALE POVERTY
0.0/ 100
METRIC RATING
327th/ 347
METRIC RANK
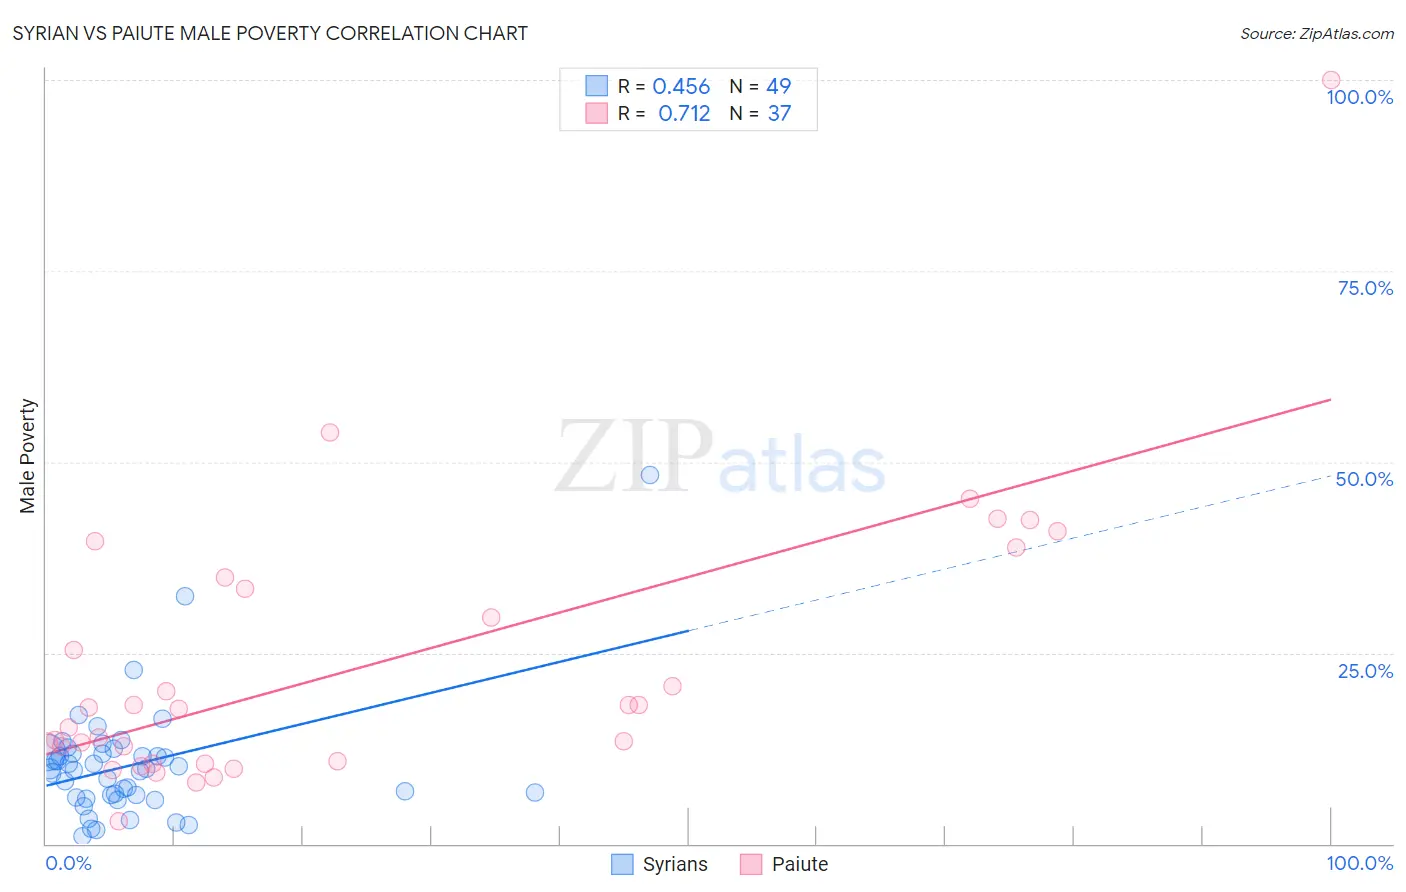
Syrian vs Paiute Male Poverty Correlation Chart
The statistical analysis conducted on geographies consisting of 266,155,974 people shows a moderate positive correlation between the proportion of Syrians and poverty level among males in the United States with a correlation coefficient (R) of 0.456 and weighted average of 10.9%. Similarly, the statistical analysis conducted on geographies consisting of 58,389,257 people shows a strong positive correlation between the proportion of Paiute and poverty level among males in the United States with a correlation coefficient (R) of 0.712 and weighted average of 15.8%, a difference of 44.5%.
Male Poverty Correlation Summary
| Measurement | Syrian | Paiute |
| Minimum | 1.0% | 2.9% |
| Maximum | 48.3% | 100.0% |
| Range | 47.3% | 97.1% |
| Mean | 10.4% | 23.1% |
| Median | 9.7% | 17.8% |
| Interquartile 25% (IQ1) | 6.2% | 10.6% |
| Interquartile 75% (IQ3) | 11.8% | 34.1% |
| Interquartile Range (IQR) | 5.7% | 23.5% |
| Standard Deviation (Sample) | 7.8% | 18.4% |
| Standard Deviation (Population) | 7.7% | 18.1% |
Similar Demographics by Male Poverty
Demographics Similar to Syrians by Male Poverty
In terms of male poverty, the demographic groups most similar to Syrians are Immigrants from Germany (10.9%, a difference of 0.030%), Samoan (10.9%, a difference of 0.050%), Afghan (10.9%, a difference of 0.070%), Icelander (11.0%, a difference of 0.34%), and Armenian (11.0%, a difference of 0.40%).
| Demographics | Rating | Rank | Male Poverty |
| Immigrants | Jordan | 77.5 /100 | #139 | Good 10.8% |
| Tlingit-Haida | 76.1 /100 | #140 | Good 10.9% |
| Immigrants | France | 75.8 /100 | #141 | Good 10.9% |
| Basques | 74.6 /100 | #142 | Good 10.9% |
| Afghans | 71.9 /100 | #143 | Good 10.9% |
| Samoans | 71.8 /100 | #144 | Good 10.9% |
| Immigrants | Germany | 71.6 /100 | #145 | Good 10.9% |
| Syrians | 71.4 /100 | #146 | Good 10.9% |
| Icelanders | 68.5 /100 | #147 | Good 11.0% |
| Armenians | 68.0 /100 | #148 | Good 11.0% |
| Immigrants | Venezuela | 67.9 /100 | #149 | Good 11.0% |
| Guamanians/Chamorros | 67.6 /100 | #150 | Good 11.0% |
| Venezuelans | 67.4 /100 | #151 | Good 11.0% |
| Immigrants | Nepal | 67.3 /100 | #152 | Good 11.0% |
| Immigrants | Bosnia and Herzegovina | 65.2 /100 | #153 | Good 11.0% |
Demographics Similar to Paiute by Male Poverty
In terms of male poverty, the demographic groups most similar to Paiute are Black/African American (15.8%, a difference of 0.060%), Dominican (16.1%, a difference of 1.8%), Immigrants from Dominican Republic (16.2%, a difference of 2.4%), Ute (16.2%, a difference of 2.8%), and Central American Indian (15.3%, a difference of 3.1%).
| Demographics | Rating | Rank | Male Poverty |
| Immigrants | Congo | 0.0 /100 | #320 | Tragic 14.7% |
| Arapaho | 0.0 /100 | #321 | Tragic 15.1% |
| Kiowa | 0.0 /100 | #322 | Tragic 15.2% |
| Colville | 0.0 /100 | #323 | Tragic 15.2% |
| Menominee | 0.0 /100 | #324 | Tragic 15.3% |
| Yakama | 0.0 /100 | #325 | Tragic 15.3% |
| Central American Indians | 0.0 /100 | #326 | Tragic 15.3% |
| Paiute | 0.0 /100 | #327 | Tragic 15.8% |
| Blacks/African Americans | 0.0 /100 | #328 | Tragic 15.8% |
| Dominicans | 0.0 /100 | #329 | Tragic 16.1% |
| Immigrants | Dominican Republic | 0.0 /100 | #330 | Tragic 16.2% |
| Ute | 0.0 /100 | #331 | Tragic 16.2% |
| Houma | 0.0 /100 | #332 | Tragic 16.7% |
| Natives/Alaskans | 0.0 /100 | #333 | Tragic 16.9% |
| Cheyenne | 0.0 /100 | #334 | Tragic 17.6% |