Ottawa vs Paiute Male Poverty
COMPARE
Ottawa
Paiute
Male Poverty
Male Poverty Comparison
Ottawa
Paiute
13.1%
MALE POVERTY
0.1/ 100
METRIC RATING
260th/ 347
METRIC RANK
15.8%
MALE POVERTY
0.0/ 100
METRIC RATING
327th/ 347
METRIC RANK
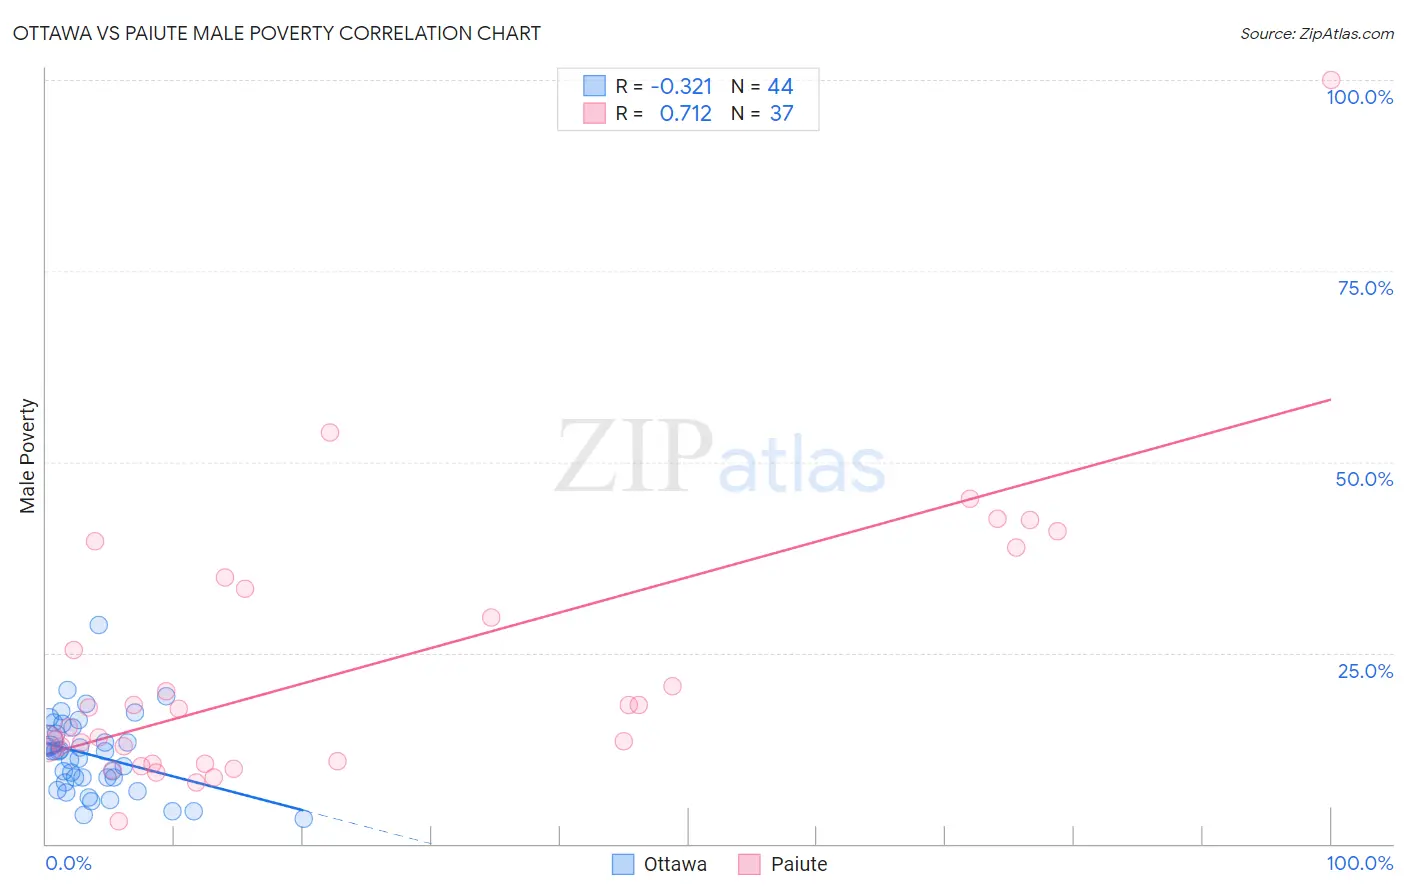
Ottawa vs Paiute Male Poverty Correlation Chart
The statistical analysis conducted on geographies consisting of 49,944,189 people shows a mild negative correlation between the proportion of Ottawa and poverty level among males in the United States with a correlation coefficient (R) of -0.321 and weighted average of 13.1%. Similarly, the statistical analysis conducted on geographies consisting of 58,389,257 people shows a strong positive correlation between the proportion of Paiute and poverty level among males in the United States with a correlation coefficient (R) of 0.712 and weighted average of 15.8%, a difference of 20.6%.
Male Poverty Correlation Summary
| Measurement | Ottawa | Paiute |
| Minimum | 3.2% | 2.9% |
| Maximum | 28.7% | 100.0% |
| Range | 25.5% | 97.1% |
| Mean | 11.6% | 23.1% |
| Median | 12.1% | 17.8% |
| Interquartile 25% (IQ1) | 8.3% | 10.6% |
| Interquartile 75% (IQ3) | 14.8% | 34.1% |
| Interquartile Range (IQR) | 6.5% | 23.5% |
| Standard Deviation (Sample) | 5.1% | 18.4% |
| Standard Deviation (Population) | 5.0% | 18.1% |
Similar Demographics by Male Poverty
Demographics Similar to Ottawa by Male Poverty
In terms of male poverty, the demographic groups most similar to Ottawa are Trinidadian and Tobagonian (13.1%, a difference of 0.020%), Spanish American Indian (13.1%, a difference of 0.070%), Cherokee (13.1%, a difference of 0.11%), Cape Verdean (13.1%, a difference of 0.28%), and Immigrants from Trinidad and Tobago (13.1%, a difference of 0.40%).
| Demographics | Rating | Rank | Male Poverty |
| Immigrants | Ghana | 0.2 /100 | #253 | Tragic 12.9% |
| Mexican American Indians | 0.1 /100 | #254 | Tragic 13.0% |
| Immigrants | Liberia | 0.1 /100 | #255 | Tragic 13.0% |
| Immigrants | Burma/Myanmar | 0.1 /100 | #256 | Tragic 13.0% |
| Immigrants | Trinidad and Tobago | 0.1 /100 | #257 | Tragic 13.1% |
| Cape Verdeans | 0.1 /100 | #258 | Tragic 13.1% |
| Cherokee | 0.1 /100 | #259 | Tragic 13.1% |
| Ottawa | 0.1 /100 | #260 | Tragic 13.1% |
| Trinidadians and Tobagonians | 0.1 /100 | #261 | Tragic 13.1% |
| Spanish American Indians | 0.1 /100 | #262 | Tragic 13.1% |
| Central Americans | 0.1 /100 | #263 | Tragic 13.2% |
| Iroquois | 0.1 /100 | #264 | Tragic 13.2% |
| Jamaicans | 0.1 /100 | #265 | Tragic 13.2% |
| Immigrants | Guyana | 0.1 /100 | #266 | Tragic 13.2% |
| Immigrants | Jamaica | 0.1 /100 | #267 | Tragic 13.3% |
Demographics Similar to Paiute by Male Poverty
In terms of male poverty, the demographic groups most similar to Paiute are Black/African American (15.8%, a difference of 0.060%), Dominican (16.1%, a difference of 1.8%), Immigrants from Dominican Republic (16.2%, a difference of 2.4%), Ute (16.2%, a difference of 2.8%), and Central American Indian (15.3%, a difference of 3.1%).
| Demographics | Rating | Rank | Male Poverty |
| Immigrants | Congo | 0.0 /100 | #320 | Tragic 14.7% |
| Arapaho | 0.0 /100 | #321 | Tragic 15.1% |
| Kiowa | 0.0 /100 | #322 | Tragic 15.2% |
| Colville | 0.0 /100 | #323 | Tragic 15.2% |
| Menominee | 0.0 /100 | #324 | Tragic 15.3% |
| Yakama | 0.0 /100 | #325 | Tragic 15.3% |
| Central American Indians | 0.0 /100 | #326 | Tragic 15.3% |
| Paiute | 0.0 /100 | #327 | Tragic 15.8% |
| Blacks/African Americans | 0.0 /100 | #328 | Tragic 15.8% |
| Dominicans | 0.0 /100 | #329 | Tragic 16.1% |
| Immigrants | Dominican Republic | 0.0 /100 | #330 | Tragic 16.2% |
| Ute | 0.0 /100 | #331 | Tragic 16.2% |
| Houma | 0.0 /100 | #332 | Tragic 16.7% |
| Natives/Alaskans | 0.0 /100 | #333 | Tragic 16.9% |
| Cheyenne | 0.0 /100 | #334 | Tragic 17.6% |