Immigrants from Kenya vs Paiute Male Poverty
COMPARE
Immigrants from Kenya
Paiute
Male Poverty
Male Poverty Comparison
Immigrants from Kenya
Paiute
11.6%
MALE POVERTY
16.1/ 100
METRIC RATING
194th/ 347
METRIC RANK
15.8%
MALE POVERTY
0.0/ 100
METRIC RATING
327th/ 347
METRIC RANK
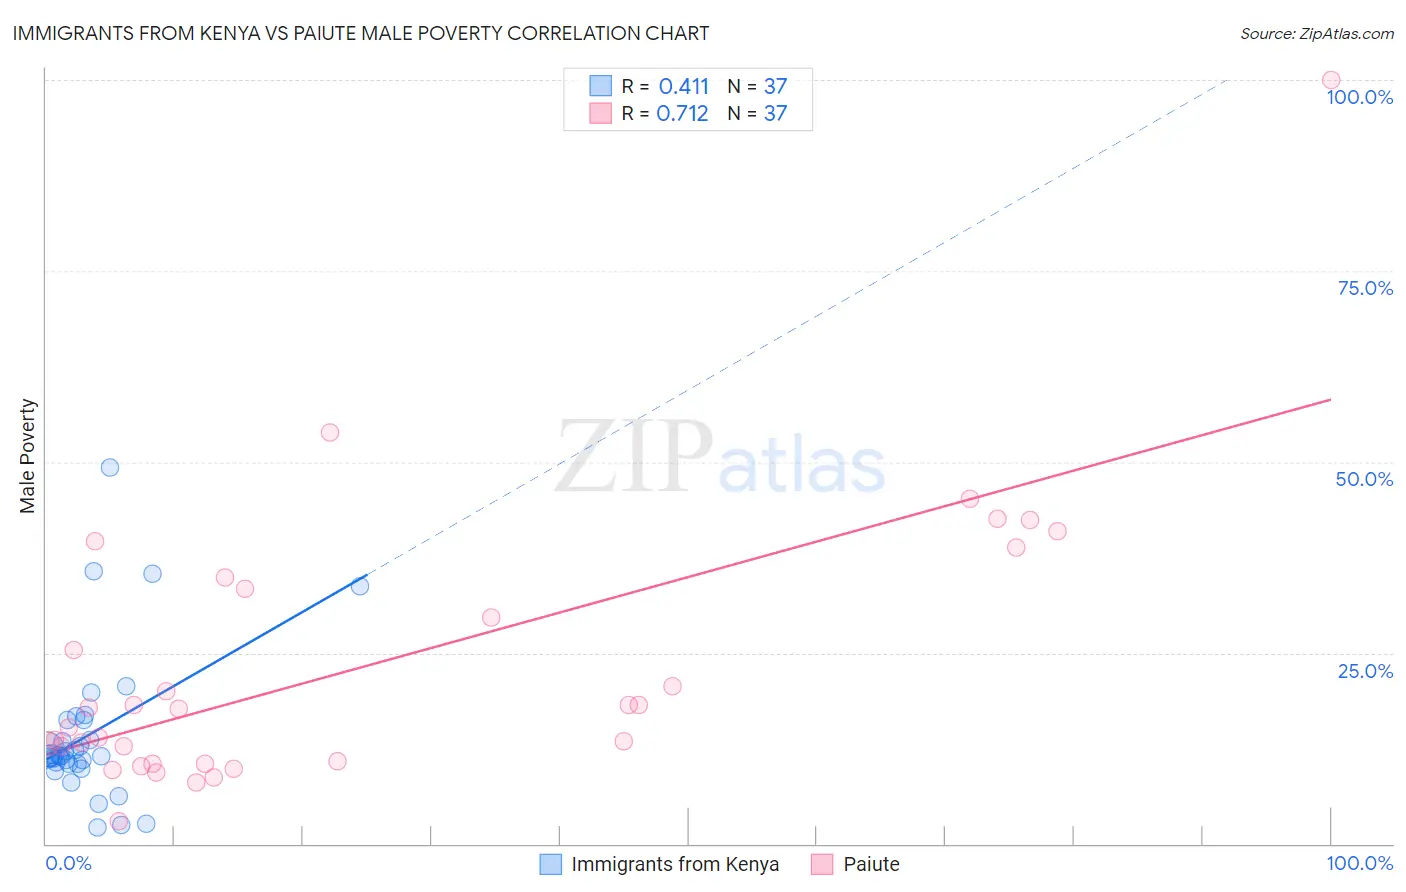
Immigrants from Kenya vs Paiute Male Poverty Correlation Chart
The statistical analysis conducted on geographies consisting of 217,973,152 people shows a moderate positive correlation between the proportion of Immigrants from Kenya and poverty level among males in the United States with a correlation coefficient (R) of 0.411 and weighted average of 11.6%. Similarly, the statistical analysis conducted on geographies consisting of 58,389,257 people shows a strong positive correlation between the proportion of Paiute and poverty level among males in the United States with a correlation coefficient (R) of 0.712 and weighted average of 15.8%, a difference of 35.7%.
Male Poverty Correlation Summary
| Measurement | Immigrants from Kenya | Paiute |
| Minimum | 2.1% | 2.9% |
| Maximum | 49.2% | 100.0% |
| Range | 47.2% | 97.1% |
| Mean | 14.3% | 23.1% |
| Median | 11.5% | 17.8% |
| Interquartile 25% (IQ1) | 10.5% | 10.6% |
| Interquartile 75% (IQ3) | 16.2% | 34.1% |
| Interquartile Range (IQR) | 5.7% | 23.5% |
| Standard Deviation (Sample) | 9.7% | 18.4% |
| Standard Deviation (Population) | 9.6% | 18.1% |
Similar Demographics by Male Poverty
Demographics Similar to Immigrants from Kenya by Male Poverty
In terms of male poverty, the demographic groups most similar to Immigrants from Kenya are Arab (11.6%, a difference of 0.050%), Hmong (11.6%, a difference of 0.050%), Delaware (11.7%, a difference of 0.12%), Immigrants from Kuwait (11.6%, a difference of 0.21%), and Iraqi (11.7%, a difference of 0.25%).
| Demographics | Rating | Rank | Male Poverty |
| Immigrants | Iraq | 31.9 /100 | #187 | Fair 11.4% |
| Sierra Leoneans | 29.9 /100 | #188 | Fair 11.4% |
| Hawaiians | 28.3 /100 | #189 | Fair 11.4% |
| Israelis | 26.1 /100 | #190 | Fair 11.5% |
| South American Indians | 22.8 /100 | #191 | Fair 11.5% |
| Immigrants | Uruguay | 19.1 /100 | #192 | Poor 11.6% |
| Immigrants | Kuwait | 17.3 /100 | #193 | Poor 11.6% |
| Immigrants | Kenya | 16.1 /100 | #194 | Poor 11.6% |
| Arabs | 15.8 /100 | #195 | Poor 11.6% |
| Hmong | 15.8 /100 | #196 | Poor 11.6% |
| Delaware | 15.4 /100 | #197 | Poor 11.7% |
| Iraqis | 14.7 /100 | #198 | Poor 11.7% |
| Spanish | 14.1 /100 | #199 | Poor 11.7% |
| Immigrants | Lebanon | 13.6 /100 | #200 | Poor 11.7% |
| Spaniards | 13.5 /100 | #201 | Poor 11.7% |
Demographics Similar to Paiute by Male Poverty
In terms of male poverty, the demographic groups most similar to Paiute are Black/African American (15.8%, a difference of 0.060%), Dominican (16.1%, a difference of 1.8%), Immigrants from Dominican Republic (16.2%, a difference of 2.4%), Ute (16.2%, a difference of 2.8%), and Central American Indian (15.3%, a difference of 3.1%).
| Demographics | Rating | Rank | Male Poverty |
| Immigrants | Congo | 0.0 /100 | #320 | Tragic 14.7% |
| Arapaho | 0.0 /100 | #321 | Tragic 15.1% |
| Kiowa | 0.0 /100 | #322 | Tragic 15.2% |
| Colville | 0.0 /100 | #323 | Tragic 15.2% |
| Menominee | 0.0 /100 | #324 | Tragic 15.3% |
| Yakama | 0.0 /100 | #325 | Tragic 15.3% |
| Central American Indians | 0.0 /100 | #326 | Tragic 15.3% |
| Paiute | 0.0 /100 | #327 | Tragic 15.8% |
| Blacks/African Americans | 0.0 /100 | #328 | Tragic 15.8% |
| Dominicans | 0.0 /100 | #329 | Tragic 16.1% |
| Immigrants | Dominican Republic | 0.0 /100 | #330 | Tragic 16.2% |
| Ute | 0.0 /100 | #331 | Tragic 16.2% |
| Houma | 0.0 /100 | #332 | Tragic 16.7% |
| Natives/Alaskans | 0.0 /100 | #333 | Tragic 16.9% |
| Cheyenne | 0.0 /100 | #334 | Tragic 17.6% |