Ukrainian vs Cajun Single Male Poverty
COMPARE
Ukrainian
Cajun
Single Male Poverty
Single Male Poverty Comparison
Ukrainians
Cajuns
12.6%
SINGLE MALE POVERTY
80.7/ 100
METRIC RATING
137th/ 347
METRIC RANK
19.1%
SINGLE MALE POVERTY
0.0/ 100
METRIC RATING
330th/ 347
METRIC RANK
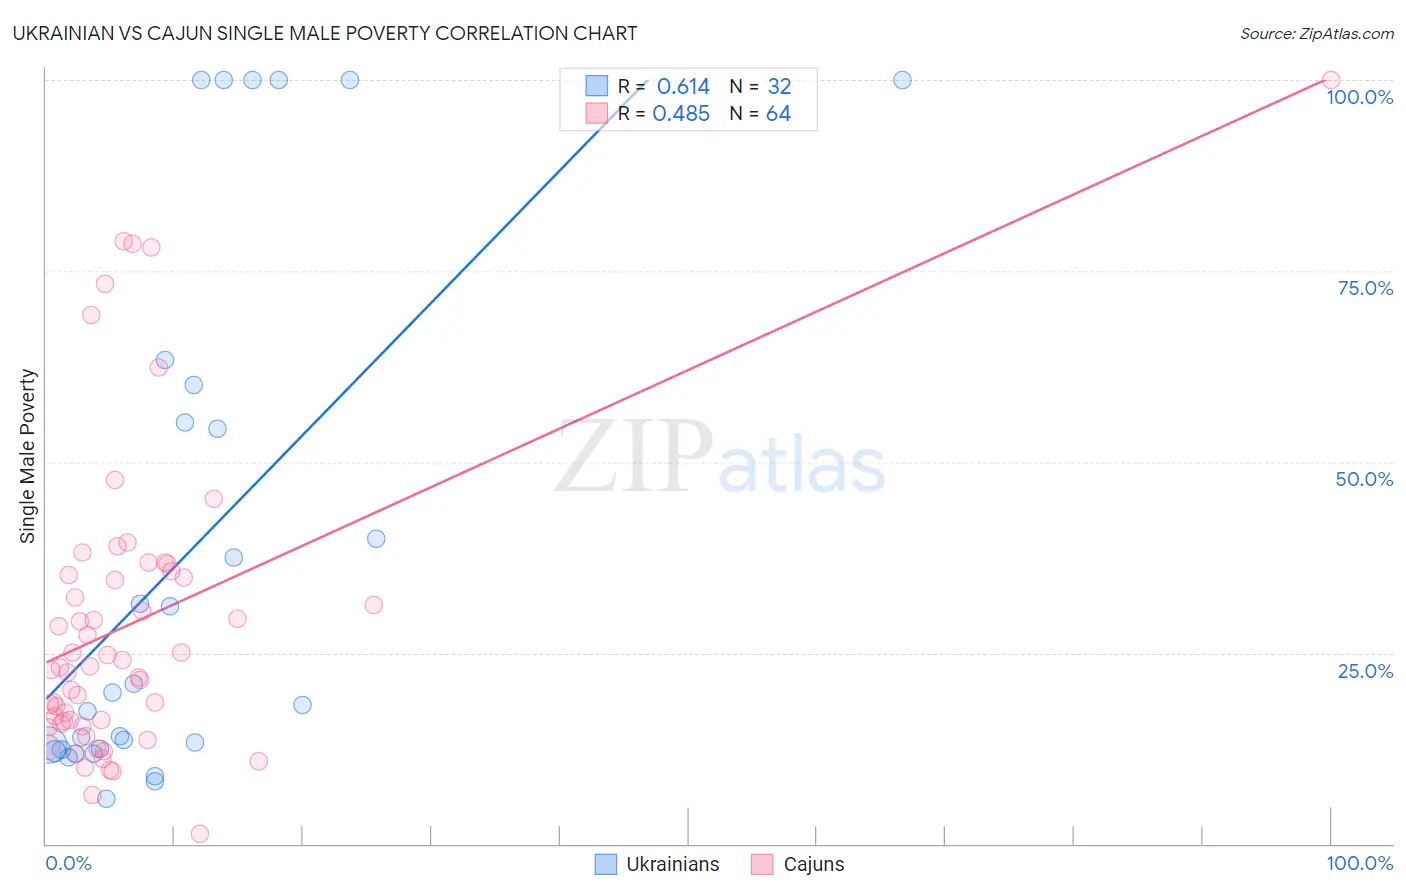
Ukrainian vs Cajun Single Male Poverty Correlation Chart
The statistical analysis conducted on geographies consisting of 384,483,508 people shows a significant positive correlation between the proportion of Ukrainians and poverty level among single males in the United States with a correlation coefficient (R) of 0.614 and weighted average of 12.6%. Similarly, the statistical analysis conducted on geographies consisting of 139,673,015 people shows a moderate positive correlation between the proportion of Cajuns and poverty level among single males in the United States with a correlation coefficient (R) of 0.485 and weighted average of 19.1%, a difference of 51.9%.
Single Male Poverty Correlation Summary
| Measurement | Ukrainian | Cajun |
| Minimum | 6.0% | 1.3% |
| Maximum | 100.0% | 100.0% |
| Range | 94.0% | 98.7% |
| Mean | 37.9% | 28.9% |
| Median | 19.0% | 23.1% |
| Interquartile 25% (IQ1) | 12.3% | 15.9% |
| Interquartile 75% (IQ3) | 57.6% | 35.5% |
| Interquartile Range (IQR) | 45.2% | 19.6% |
| Standard Deviation (Sample) | 34.1% | 20.0% |
| Standard Deviation (Population) | 33.6% | 19.9% |
Similar Demographics by Single Male Poverty
Demographics Similar to Ukrainians by Single Male Poverty
In terms of single male poverty, the demographic groups most similar to Ukrainians are Immigrants from El Salvador (12.6%, a difference of 0.060%), Cuban (12.6%, a difference of 0.070%), Immigrants from Costa Rica (12.5%, a difference of 0.11%), Immigrants from Austria (12.5%, a difference of 0.11%), and Immigrants from Ecuador (12.5%, a difference of 0.12%).
| Demographics | Rating | Rank | Single Male Poverty |
| Immigrants | Nicaragua | 84.8 /100 | #130 | Excellent 12.5% |
| Immigrants | Northern Europe | 83.7 /100 | #131 | Excellent 12.5% |
| Salvadorans | 83.7 /100 | #132 | Excellent 12.5% |
| Immigrants | Western Asia | 83.4 /100 | #133 | Excellent 12.5% |
| Immigrants | Ecuador | 82.1 /100 | #134 | Excellent 12.5% |
| Immigrants | Costa Rica | 81.9 /100 | #135 | Excellent 12.5% |
| Immigrants | Austria | 81.9 /100 | #136 | Excellent 12.5% |
| Ukrainians | 80.7 /100 | #137 | Excellent 12.6% |
| Immigrants | El Salvador | 80.0 /100 | #138 | Excellent 12.6% |
| Cubans | 79.9 /100 | #139 | Good 12.6% |
| Immigrants | Zimbabwe | 78.0 /100 | #140 | Good 12.6% |
| Okinawans | 75.9 /100 | #141 | Good 12.6% |
| Immigrants | Uganda | 75.9 /100 | #142 | Good 12.6% |
| Immigrants | France | 75.8 /100 | #143 | Good 12.6% |
| Hawaiians | 75.1 /100 | #144 | Good 12.6% |
Demographics Similar to Cajuns by Single Male Poverty
In terms of single male poverty, the demographic groups most similar to Cajuns are Paiute (19.3%, a difference of 1.1%), Native/Alaskan (19.6%, a difference of 2.8%), Colville (18.4%, a difference of 3.5%), Kiowa (18.3%, a difference of 4.2%), and Inupiat (20.0%, a difference of 4.8%).
| Demographics | Rating | Rank | Single Male Poverty |
| Creek | 0.0 /100 | #323 | Tragic 16.8% |
| Immigrants | Yemen | 0.0 /100 | #324 | Tragic 16.9% |
| Choctaw | 0.0 /100 | #325 | Tragic 17.0% |
| Central American Indians | 0.0 /100 | #326 | Tragic 17.2% |
| Menominee | 0.0 /100 | #327 | Tragic 17.7% |
| Kiowa | 0.0 /100 | #328 | Tragic 18.3% |
| Colville | 0.0 /100 | #329 | Tragic 18.4% |
| Cajuns | 0.0 /100 | #330 | Tragic 19.1% |
| Paiute | 0.0 /100 | #331 | Tragic 19.3% |
| Natives/Alaskans | 0.0 /100 | #332 | Tragic 19.6% |
| Inupiat | 0.0 /100 | #333 | Tragic 20.0% |
| Pima | 0.0 /100 | #334 | Tragic 20.2% |
| Yuman | 0.0 /100 | #335 | Tragic 21.3% |
| Tohono O'odham | 0.0 /100 | #336 | Tragic 21.6% |
| Apache | 0.0 /100 | #337 | Tragic 21.6% |