Ukrainian vs Portuguese Single Male Poverty
COMPARE
Ukrainian
Portuguese
Single Male Poverty
Single Male Poverty Comparison
Ukrainians
Portuguese
12.6%
SINGLE MALE POVERTY
80.7/ 100
METRIC RATING
137th/ 347
METRIC RANK
12.9%
SINGLE MALE POVERTY
30.2/ 100
METRIC RATING
189th/ 347
METRIC RANK
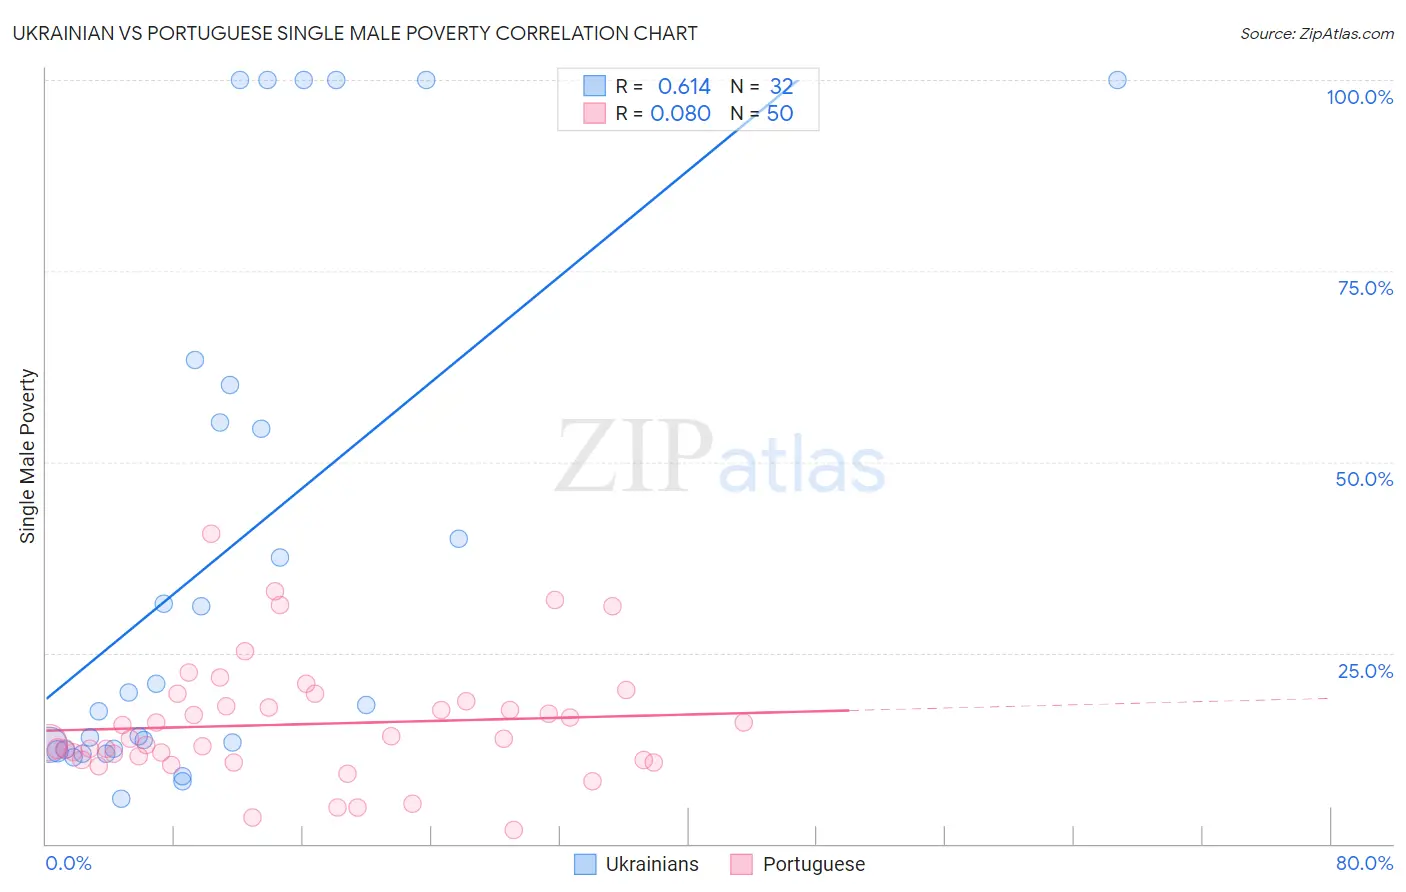
Ukrainian vs Portuguese Single Male Poverty Correlation Chart
The statistical analysis conducted on geographies consisting of 384,483,508 people shows a significant positive correlation between the proportion of Ukrainians and poverty level among single males in the United States with a correlation coefficient (R) of 0.614 and weighted average of 12.6%. Similarly, the statistical analysis conducted on geographies consisting of 390,984,789 people shows a slight positive correlation between the proportion of Portuguese and poverty level among single males in the United States with a correlation coefficient (R) of 0.080 and weighted average of 12.9%, a difference of 3.0%.
Single Male Poverty Correlation Summary
| Measurement | Ukrainian | Portuguese |
| Minimum | 6.0% | 1.7% |
| Maximum | 100.0% | 40.6% |
| Range | 94.0% | 38.8% |
| Mean | 37.9% | 15.7% |
| Median | 19.0% | 13.7% |
| Interquartile 25% (IQ1) | 12.3% | 11.0% |
| Interquartile 75% (IQ3) | 57.6% | 18.7% |
| Interquartile Range (IQR) | 45.2% | 7.7% |
| Standard Deviation (Sample) | 34.1% | 7.9% |
| Standard Deviation (Population) | 33.6% | 7.8% |
Similar Demographics by Single Male Poverty
Demographics Similar to Ukrainians by Single Male Poverty
In terms of single male poverty, the demographic groups most similar to Ukrainians are Immigrants from El Salvador (12.6%, a difference of 0.060%), Cuban (12.6%, a difference of 0.070%), Immigrants from Costa Rica (12.5%, a difference of 0.11%), Immigrants from Austria (12.5%, a difference of 0.11%), and Immigrants from Ecuador (12.5%, a difference of 0.12%).
| Demographics | Rating | Rank | Single Male Poverty |
| Immigrants | Nicaragua | 84.8 /100 | #130 | Excellent 12.5% |
| Immigrants | Northern Europe | 83.7 /100 | #131 | Excellent 12.5% |
| Salvadorans | 83.7 /100 | #132 | Excellent 12.5% |
| Immigrants | Western Asia | 83.4 /100 | #133 | Excellent 12.5% |
| Immigrants | Ecuador | 82.1 /100 | #134 | Excellent 12.5% |
| Immigrants | Costa Rica | 81.9 /100 | #135 | Excellent 12.5% |
| Immigrants | Austria | 81.9 /100 | #136 | Excellent 12.5% |
| Ukrainians | 80.7 /100 | #137 | Excellent 12.6% |
| Immigrants | El Salvador | 80.0 /100 | #138 | Excellent 12.6% |
| Cubans | 79.9 /100 | #139 | Good 12.6% |
| Immigrants | Zimbabwe | 78.0 /100 | #140 | Good 12.6% |
| Okinawans | 75.9 /100 | #141 | Good 12.6% |
| Immigrants | Uganda | 75.9 /100 | #142 | Good 12.6% |
| Immigrants | France | 75.8 /100 | #143 | Good 12.6% |
| Hawaiians | 75.1 /100 | #144 | Good 12.6% |
Demographics Similar to Portuguese by Single Male Poverty
In terms of single male poverty, the demographic groups most similar to Portuguese are Macedonian (12.9%, a difference of 0.080%), Nigerian (12.9%, a difference of 0.10%), Immigrants from Kuwait (12.9%, a difference of 0.10%), Norwegian (12.9%, a difference of 0.11%), and Immigrants from Trinidad and Tobago (12.9%, a difference of 0.14%).
| Demographics | Rating | Rank | Single Male Poverty |
| Moroccans | 36.8 /100 | #182 | Fair 12.9% |
| Immigrants | West Indies | 33.0 /100 | #183 | Fair 12.9% |
| Immigrants | Trinidad and Tobago | 32.5 /100 | #184 | Fair 12.9% |
| Norwegians | 32.0 /100 | #185 | Fair 12.9% |
| Nigerians | 31.9 /100 | #186 | Fair 12.9% |
| Immigrants | Kuwait | 31.9 /100 | #187 | Fair 12.9% |
| Macedonians | 31.5 /100 | #188 | Fair 12.9% |
| Portuguese | 30.2 /100 | #189 | Fair 12.9% |
| Arabs | 27.0 /100 | #190 | Fair 13.0% |
| Immigrants | Thailand | 26.6 /100 | #191 | Fair 13.0% |
| Immigrants | Jamaica | 26.5 /100 | #192 | Fair 13.0% |
| Immigrants | South Africa | 26.1 /100 | #193 | Fair 13.0% |
| Liberians | 25.2 /100 | #194 | Fair 13.0% |
| Immigrants | England | 23.4 /100 | #195 | Fair 13.0% |
| Immigrants | Grenada | 23.1 /100 | #196 | Fair 13.0% |