Ugandan vs Yup'ik Family Poverty
COMPARE
Ugandan
Yup'ik
Family Poverty
Family Poverty Comparison
Ugandans
Yup'ik
9.3%
FAMILY POVERTY
28.7/ 100
METRIC RATING
191st/ 347
METRIC RANK
18.7%
FAMILY POVERTY
0.0/ 100
METRIC RATING
344th/ 347
METRIC RANK
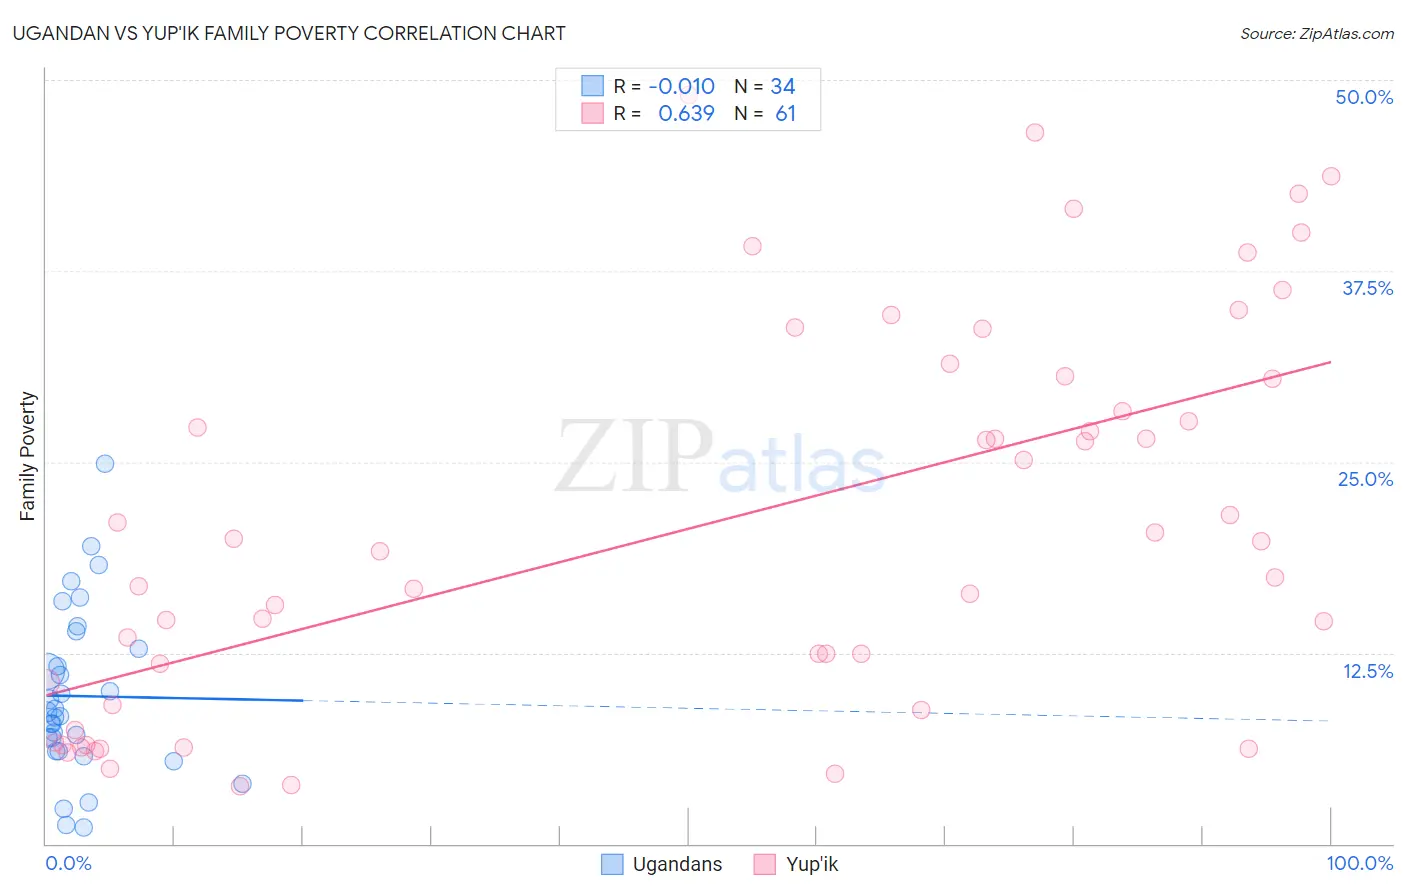
Ugandan vs Yup'ik Family Poverty Correlation Chart
The statistical analysis conducted on geographies consisting of 93,955,553 people shows no correlation between the proportion of Ugandans and poverty level among families in the United States with a correlation coefficient (R) of -0.010 and weighted average of 9.3%. Similarly, the statistical analysis conducted on geographies consisting of 39,939,403 people shows a significant positive correlation between the proportion of Yup'ik and poverty level among families in the United States with a correlation coefficient (R) of 0.639 and weighted average of 18.7%, a difference of 101.7%.
Family Poverty Correlation Summary
| Measurement | Ugandan | Yup'ik |
| Minimum | 1.0% | 3.7% |
| Maximum | 24.9% | 49.0% |
| Range | 23.8% | 45.2% |
| Mean | 9.7% | 20.8% |
| Median | 8.5% | 19.1% |
| Interquartile 25% (IQ1) | 6.0% | 8.9% |
| Interquartile 75% (IQ3) | 12.7% | 30.5% |
| Interquartile Range (IQR) | 6.7% | 21.6% |
| Standard Deviation (Sample) | 5.4% | 12.7% |
| Standard Deviation (Population) | 5.4% | 12.6% |
Similar Demographics by Family Poverty
Demographics Similar to Ugandans by Family Poverty
In terms of family poverty, the demographic groups most similar to Ugandans are Spanish (9.3%, a difference of 0.010%), Immigrants from Western Asia (9.3%, a difference of 0.080%), South American (9.3%, a difference of 0.10%), Venezuelan (9.3%, a difference of 0.22%), and Arab (9.2%, a difference of 0.41%).
| Demographics | Rating | Rank | Family Poverty |
| South American Indians | 38.7 /100 | #184 | Fair 9.1% |
| Immigrants | Saudi Arabia | 38.6 /100 | #185 | Fair 9.1% |
| Colombians | 36.1 /100 | #186 | Fair 9.2% |
| Delaware | 35.4 /100 | #187 | Fair 9.2% |
| Immigrants | Kenya | 34.0 /100 | #188 | Fair 9.2% |
| Immigrants | Afghanistan | 32.1 /100 | #189 | Fair 9.2% |
| Arabs | 31.5 /100 | #190 | Fair 9.2% |
| Ugandans | 28.7 /100 | #191 | Fair 9.3% |
| Spanish | 28.7 /100 | #192 | Fair 9.3% |
| Immigrants | Western Asia | 28.2 /100 | #193 | Fair 9.3% |
| South Americans | 28.1 /100 | #194 | Fair 9.3% |
| Venezuelans | 27.4 /100 | #195 | Fair 9.3% |
| Immigrants | Venezuela | 26.1 /100 | #196 | Fair 9.3% |
| Immigrants | Colombia | 24.4 /100 | #197 | Fair 9.3% |
| Iraqis | 24.2 /100 | #198 | Fair 9.3% |
Demographics Similar to Yup'ik by Family Poverty
In terms of family poverty, the demographic groups most similar to Yup'ik are Navajo (18.8%, a difference of 0.55%), Pima (18.4%, a difference of 1.8%), Immigrants from Yemen (17.5%, a difference of 7.1%), Puerto Rican (20.3%, a difference of 8.6%), and Tohono O'odham (20.4%, a difference of 9.0%).
| Demographics | Rating | Rank | Family Poverty |
| Immigrants | Dominican Republic | 0.0 /100 | #333 | Tragic 14.4% |
| Houma | 0.0 /100 | #334 | Tragic 14.6% |
| Apache | 0.0 /100 | #335 | Tragic 14.7% |
| Sioux | 0.0 /100 | #336 | Tragic 15.9% |
| Hopi | 0.0 /100 | #337 | Tragic 15.9% |
| Crow | 0.0 /100 | #338 | Tragic 16.1% |
| Yuman | 0.0 /100 | #339 | Tragic 16.6% |
| Pueblo | 0.0 /100 | #340 | Tragic 17.0% |
| Lumbee | 0.0 /100 | #341 | Tragic 17.0% |
| Immigrants | Yemen | 0.0 /100 | #342 | Tragic 17.5% |
| Pima | 0.0 /100 | #343 | Tragic 18.4% |
| Yup'ik | 0.0 /100 | #344 | Tragic 18.7% |
| Navajo | 0.0 /100 | #345 | Tragic 18.8% |
| Puerto Ricans | 0.0 /100 | #346 | Tragic 20.3% |
| Tohono O'odham | 0.0 /100 | #347 | Tragic 20.4% |