Ugandan vs Immigrants from Central America Family Poverty
COMPARE
Ugandan
Immigrants from Central America
Family Poverty
Family Poverty Comparison
Ugandans
Immigrants from Central America
9.3%
FAMILY POVERTY
28.7/ 100
METRIC RATING
191st/ 347
METRIC RANK
12.1%
FAMILY POVERTY
0.0/ 100
METRIC RATING
312th/ 347
METRIC RANK
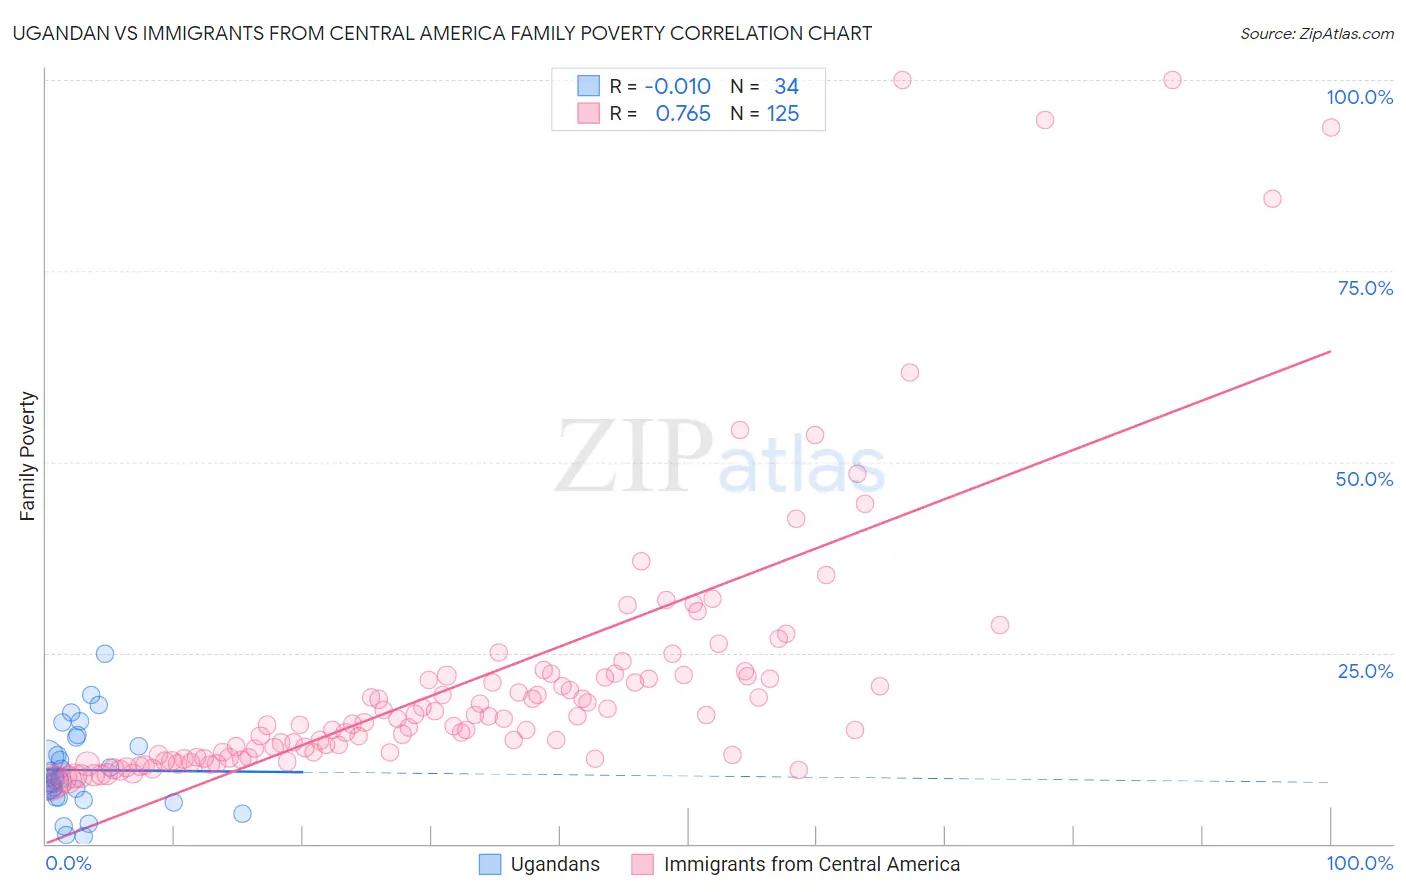
Ugandan vs Immigrants from Central America Family Poverty Correlation Chart
The statistical analysis conducted on geographies consisting of 93,955,553 people shows no correlation between the proportion of Ugandans and poverty level among families in the United States with a correlation coefficient (R) of -0.010 and weighted average of 9.3%. Similarly, the statistical analysis conducted on geographies consisting of 533,860,839 people shows a strong positive correlation between the proportion of Immigrants from Central America and poverty level among families in the United States with a correlation coefficient (R) of 0.765 and weighted average of 12.1%, a difference of 30.5%.
Family Poverty Correlation Summary
| Measurement | Ugandan | Immigrants from Central America |
| Minimum | 1.0% | 8.0% |
| Maximum | 24.9% | 100.0% |
| Range | 23.8% | 92.0% |
| Mean | 9.7% | 21.3% |
| Median | 8.5% | 15.8% |
| Interquartile 25% (IQ1) | 6.0% | 11.3% |
| Interquartile 75% (IQ3) | 12.7% | 22.0% |
| Interquartile Range (IQR) | 6.7% | 10.7% |
| Standard Deviation (Sample) | 5.4% | 17.9% |
| Standard Deviation (Population) | 5.4% | 17.8% |
Similar Demographics by Family Poverty
Demographics Similar to Ugandans by Family Poverty
In terms of family poverty, the demographic groups most similar to Ugandans are Spanish (9.3%, a difference of 0.010%), Immigrants from Western Asia (9.3%, a difference of 0.080%), South American (9.3%, a difference of 0.10%), Venezuelan (9.3%, a difference of 0.22%), and Arab (9.2%, a difference of 0.41%).
| Demographics | Rating | Rank | Family Poverty |
| South American Indians | 38.7 /100 | #184 | Fair 9.1% |
| Immigrants | Saudi Arabia | 38.6 /100 | #185 | Fair 9.1% |
| Colombians | 36.1 /100 | #186 | Fair 9.2% |
| Delaware | 35.4 /100 | #187 | Fair 9.2% |
| Immigrants | Kenya | 34.0 /100 | #188 | Fair 9.2% |
| Immigrants | Afghanistan | 32.1 /100 | #189 | Fair 9.2% |
| Arabs | 31.5 /100 | #190 | Fair 9.2% |
| Ugandans | 28.7 /100 | #191 | Fair 9.3% |
| Spanish | 28.7 /100 | #192 | Fair 9.3% |
| Immigrants | Western Asia | 28.2 /100 | #193 | Fair 9.3% |
| South Americans | 28.1 /100 | #194 | Fair 9.3% |
| Venezuelans | 27.4 /100 | #195 | Fair 9.3% |
| Immigrants | Venezuela | 26.1 /100 | #196 | Fair 9.3% |
| Immigrants | Colombia | 24.4 /100 | #197 | Fair 9.3% |
| Iraqis | 24.2 /100 | #198 | Fair 9.3% |
Demographics Similar to Immigrants from Central America by Family Poverty
In terms of family poverty, the demographic groups most similar to Immigrants from Central America are Ute (12.1%, a difference of 0.38%), Immigrants from Caribbean (12.2%, a difference of 0.68%), Kiowa (12.2%, a difference of 1.2%), Hispanic or Latino (12.0%, a difference of 1.2%), and Immigrants from Guatemala (12.0%, a difference of 1.2%).
| Demographics | Rating | Rank | Family Poverty |
| Mexicans | 0.0 /100 | #305 | Tragic 11.8% |
| Cajuns | 0.0 /100 | #306 | Tragic 11.9% |
| Immigrants | Congo | 0.0 /100 | #307 | Tragic 11.9% |
| Seminole | 0.0 /100 | #308 | Tragic 11.9% |
| Hispanics or Latinos | 0.0 /100 | #309 | Tragic 12.0% |
| Immigrants | Guatemala | 0.0 /100 | #310 | Tragic 12.0% |
| Ute | 0.0 /100 | #311 | Tragic 12.1% |
| Immigrants | Central America | 0.0 /100 | #312 | Tragic 12.1% |
| Immigrants | Caribbean | 0.0 /100 | #313 | Tragic 12.2% |
| Kiowa | 0.0 /100 | #314 | Tragic 12.2% |
| Immigrants | Mexico | 0.0 /100 | #315 | Tragic 12.3% |
| Hondurans | 0.0 /100 | #316 | Tragic 12.4% |
| Immigrants | Grenada | 0.0 /100 | #317 | Tragic 12.4% |
| U.S. Virgin Islanders | 0.0 /100 | #318 | Tragic 12.4% |
| British West Indians | 0.0 /100 | #319 | Tragic 12.4% |