Potawatomi vs Yup'ik Family Poverty
COMPARE
Potawatomi
Yup'ik
Family Poverty
Family Poverty Comparison
Potawatomi
Yup'ik
10.2%
FAMILY POVERTY
1.5/ 100
METRIC RATING
239th/ 347
METRIC RANK
18.7%
FAMILY POVERTY
0.0/ 100
METRIC RATING
344th/ 347
METRIC RANK
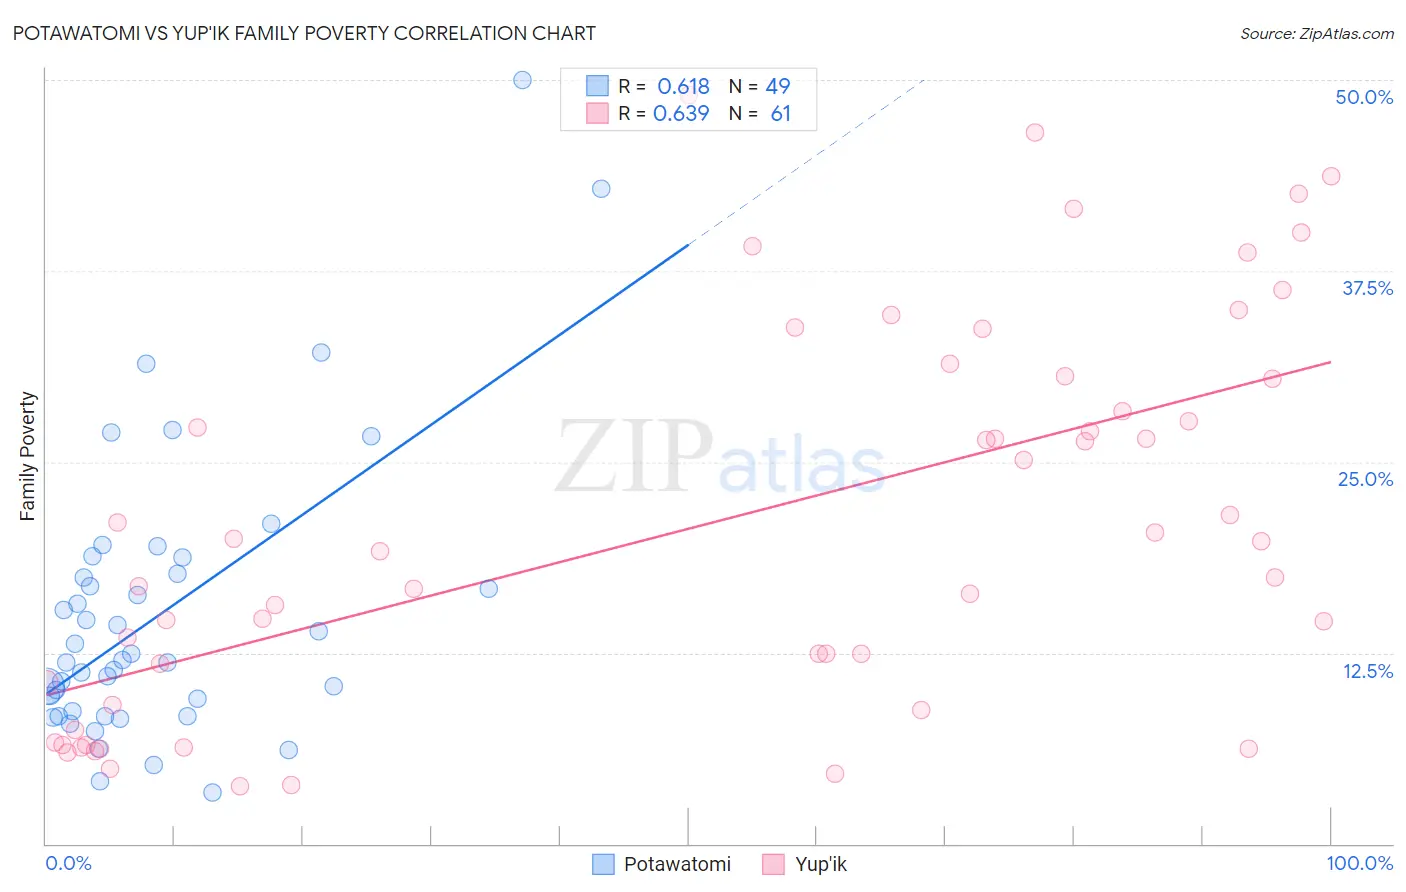
Potawatomi vs Yup'ik Family Poverty Correlation Chart
The statistical analysis conducted on geographies consisting of 117,705,487 people shows a significant positive correlation between the proportion of Potawatomi and poverty level among families in the United States with a correlation coefficient (R) of 0.618 and weighted average of 10.2%. Similarly, the statistical analysis conducted on geographies consisting of 39,939,403 people shows a significant positive correlation between the proportion of Yup'ik and poverty level among families in the United States with a correlation coefficient (R) of 0.639 and weighted average of 18.7%, a difference of 82.7%.
Family Poverty Correlation Summary
| Measurement | Potawatomi | Yup'ik |
| Minimum | 3.4% | 3.7% |
| Maximum | 50.0% | 49.0% |
| Range | 46.6% | 45.2% |
| Mean | 15.1% | 20.8% |
| Median | 12.0% | 19.1% |
| Interquartile 25% (IQ1) | 8.5% | 8.9% |
| Interquartile 75% (IQ3) | 18.2% | 30.5% |
| Interquartile Range (IQR) | 9.7% | 21.6% |
| Standard Deviation (Sample) | 9.4% | 12.7% |
| Standard Deviation (Population) | 9.3% | 12.6% |
Similar Demographics by Family Poverty
Demographics Similar to Potawatomi by Family Poverty
In terms of family poverty, the demographic groups most similar to Potawatomi are French American Indian (10.2%, a difference of 0.040%), Immigrants from the Azores (10.3%, a difference of 0.31%), Ghanaian (10.3%, a difference of 0.39%), Immigrants from Laos (10.2%, a difference of 0.40%), and Immigrants from Nigeria (10.2%, a difference of 0.67%).
| Demographics | Rating | Rank | Family Poverty |
| Immigrants | Sudan | 2.3 /100 | #232 | Tragic 10.1% |
| Fijians | 2.1 /100 | #233 | Tragic 10.1% |
| Immigrants | Middle Africa | 2.1 /100 | #234 | Tragic 10.1% |
| Nigerians | 2.0 /100 | #235 | Tragic 10.1% |
| Immigrants | Nigeria | 1.9 /100 | #236 | Tragic 10.2% |
| Immigrants | Laos | 1.7 /100 | #237 | Tragic 10.2% |
| French American Indians | 1.5 /100 | #238 | Tragic 10.2% |
| Potawatomi | 1.5 /100 | #239 | Tragic 10.2% |
| Immigrants | Azores | 1.4 /100 | #240 | Tragic 10.3% |
| Ghanaians | 1.3 /100 | #241 | Tragic 10.3% |
| Alaska Natives | 1.0 /100 | #242 | Tragic 10.4% |
| Nepalese | 0.8 /100 | #243 | Tragic 10.4% |
| Cree | 0.7 /100 | #244 | Tragic 10.5% |
| Immigrants | Burma/Myanmar | 0.6 /100 | #245 | Tragic 10.5% |
| Cherokee | 0.5 /100 | #246 | Tragic 10.6% |
Demographics Similar to Yup'ik by Family Poverty
In terms of family poverty, the demographic groups most similar to Yup'ik are Navajo (18.8%, a difference of 0.55%), Pima (18.4%, a difference of 1.8%), Immigrants from Yemen (17.5%, a difference of 7.1%), Puerto Rican (20.3%, a difference of 8.6%), and Tohono O'odham (20.4%, a difference of 9.0%).
| Demographics | Rating | Rank | Family Poverty |
| Immigrants | Dominican Republic | 0.0 /100 | #333 | Tragic 14.4% |
| Houma | 0.0 /100 | #334 | Tragic 14.6% |
| Apache | 0.0 /100 | #335 | Tragic 14.7% |
| Sioux | 0.0 /100 | #336 | Tragic 15.9% |
| Hopi | 0.0 /100 | #337 | Tragic 15.9% |
| Crow | 0.0 /100 | #338 | Tragic 16.1% |
| Yuman | 0.0 /100 | #339 | Tragic 16.6% |
| Pueblo | 0.0 /100 | #340 | Tragic 17.0% |
| Lumbee | 0.0 /100 | #341 | Tragic 17.0% |
| Immigrants | Yemen | 0.0 /100 | #342 | Tragic 17.5% |
| Pima | 0.0 /100 | #343 | Tragic 18.4% |
| Yup'ik | 0.0 /100 | #344 | Tragic 18.7% |
| Navajo | 0.0 /100 | #345 | Tragic 18.8% |
| Puerto Ricans | 0.0 /100 | #346 | Tragic 20.3% |
| Tohono O'odham | 0.0 /100 | #347 | Tragic 20.4% |