Lebanese vs Polish Single Mother Poverty
COMPARE
Lebanese
Polish
Single Mother Poverty
Single Mother Poverty Comparison
Lebanese
Poles
29.4%
SINGLE MOTHER POVERTY
32.5/ 100
METRIC RATING
187th/ 347
METRIC RANK
28.4%
SINGLE MOTHER POVERTY
90.8/ 100
METRIC RATING
127th/ 347
METRIC RANK
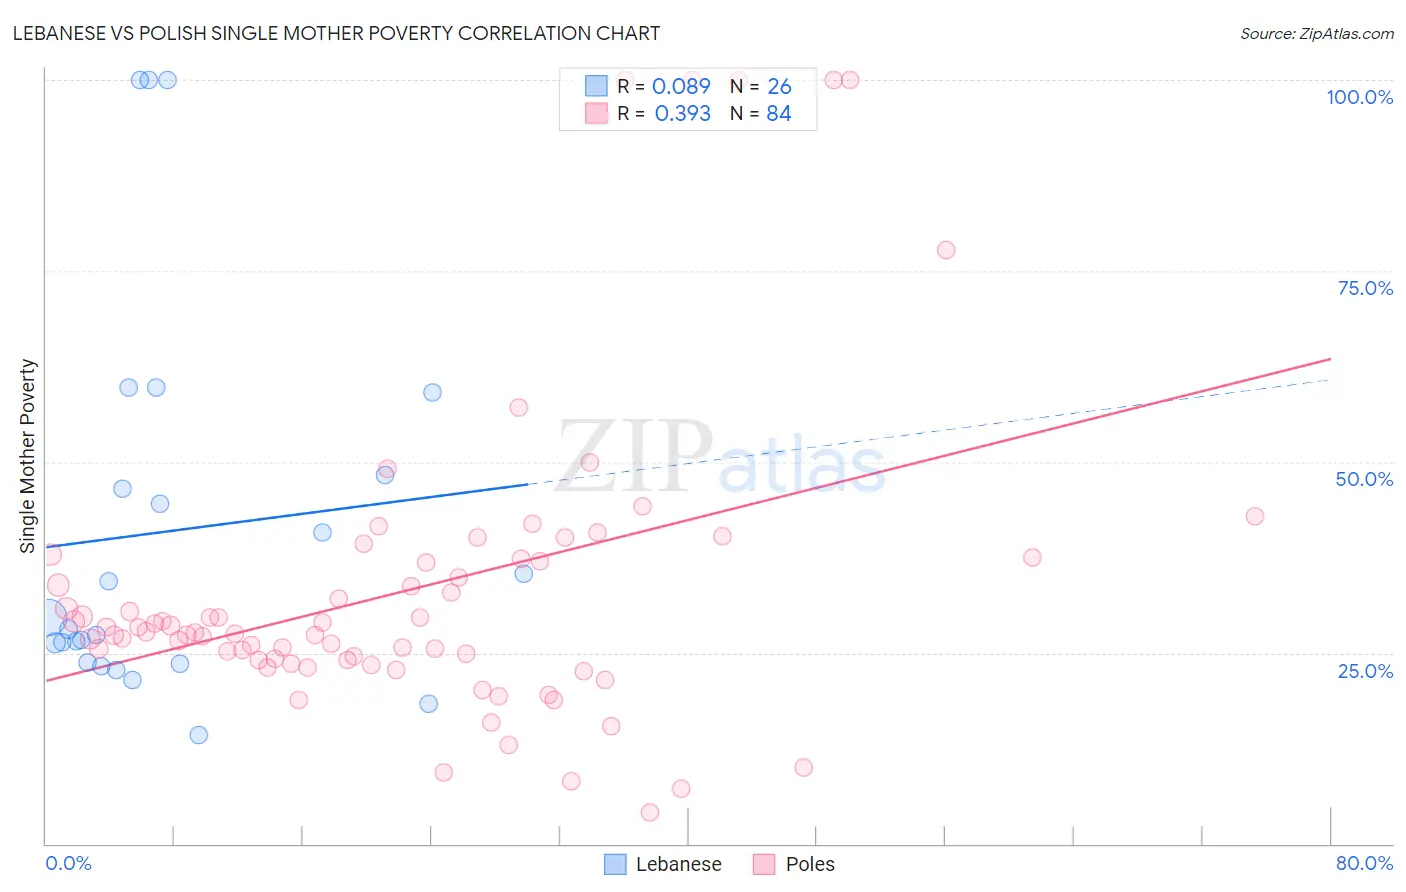
Lebanese vs Polish Single Mother Poverty Correlation Chart
The statistical analysis conducted on geographies consisting of 390,539,511 people shows a slight positive correlation between the proportion of Lebanese and poverty level among single mothers in the United States with a correlation coefficient (R) of 0.089 and weighted average of 29.4%. Similarly, the statistical analysis conducted on geographies consisting of 533,048,223 people shows a mild positive correlation between the proportion of Poles and poverty level among single mothers in the United States with a correlation coefficient (R) of 0.393 and weighted average of 28.4%, a difference of 3.7%.
Single Mother Poverty Correlation Summary
| Measurement | Lebanese | Polish |
| Minimum | 14.3% | 4.1% |
| Maximum | 100.0% | 100.0% |
| Range | 85.7% | 95.9% |
| Mean | 41.0% | 33.1% |
| Median | 28.9% | 27.7% |
| Interquartile 25% (IQ1) | 23.8% | 24.1% |
| Interquartile 75% (IQ3) | 48.2% | 37.2% |
| Interquartile Range (IQR) | 24.4% | 13.1% |
| Standard Deviation (Sample) | 25.2% | 20.1% |
| Standard Deviation (Population) | 24.7% | 20.0% |
Similar Demographics by Single Mother Poverty
Demographics Similar to Lebanese by Single Mother Poverty
In terms of single mother poverty, the demographic groups most similar to Lebanese are Guamanian/Chamorro (29.4%, a difference of 0.040%), Immigrants from Africa (29.4%, a difference of 0.050%), Immigrants from Germany (29.5%, a difference of 0.11%), Immigrants from Trinidad and Tobago (29.5%, a difference of 0.18%), and Yugoslavian (29.4%, a difference of 0.19%).
| Demographics | Rating | Rank | Single Mother Poverty |
| Immigrants | Norway | 41.5 /100 | #180 | Average 29.3% |
| Canadians | 40.4 /100 | #181 | Average 29.3% |
| Immigrants | Eastern Africa | 38.5 /100 | #182 | Fair 29.3% |
| Nepalese | 38.3 /100 | #183 | Fair 29.3% |
| Nigerians | 38.0 /100 | #184 | Fair 29.3% |
| Ghanaians | 36.8 /100 | #185 | Fair 29.4% |
| Yugoslavians | 36.0 /100 | #186 | Fair 29.4% |
| Lebanese | 32.5 /100 | #187 | Fair 29.4% |
| Guamanians/Chamorros | 31.8 /100 | #188 | Fair 29.4% |
| Immigrants | Africa | 31.6 /100 | #189 | Fair 29.4% |
| Immigrants | Germany | 30.4 /100 | #190 | Fair 29.5% |
| Immigrants | Trinidad and Tobago | 29.2 /100 | #191 | Fair 29.5% |
| Moroccans | 28.6 /100 | #192 | Fair 29.5% |
| Basques | 28.3 /100 | #193 | Fair 29.5% |
| Icelanders | 26.1 /100 | #194 | Fair 29.5% |
Demographics Similar to Poles by Single Mother Poverty
In terms of single mother poverty, the demographic groups most similar to Poles are Immigrants from Chile (28.4%, a difference of 0.010%), Kenyan (28.4%, a difference of 0.020%), Immigrants from England (28.4%, a difference of 0.030%), South American (28.4%, a difference of 0.060%), and Norwegian (28.4%, a difference of 0.060%).
| Demographics | Rating | Rank | Single Mother Poverty |
| Cypriots | 92.3 /100 | #120 | Exceptional 28.3% |
| Immigrants | Afghanistan | 92.1 /100 | #121 | Exceptional 28.3% |
| Colombians | 91.8 /100 | #122 | Exceptional 28.3% |
| Uruguayans | 91.7 /100 | #123 | Exceptional 28.3% |
| Immigrants | Switzerland | 91.7 /100 | #124 | Exceptional 28.3% |
| Kenyans | 90.9 /100 | #125 | Exceptional 28.4% |
| Immigrants | Chile | 90.8 /100 | #126 | Exceptional 28.4% |
| Poles | 90.8 /100 | #127 | Exceptional 28.4% |
| Immigrants | England | 90.5 /100 | #128 | Exceptional 28.4% |
| South Americans | 90.4 /100 | #129 | Exceptional 28.4% |
| Norwegians | 90.4 /100 | #130 | Exceptional 28.4% |
| Immigrants | Austria | 90.3 /100 | #131 | Exceptional 28.4% |
| Immigrants | Morocco | 89.5 /100 | #132 | Excellent 28.4% |
| Swedes | 89.4 /100 | #133 | Excellent 28.4% |
| Immigrants | Southern Europe | 89.2 /100 | #134 | Excellent 28.4% |