Immigrants from Venezuela vs Polish Single Mother Poverty
COMPARE
Immigrants from Venezuela
Polish
Single Mother Poverty
Single Mother Poverty Comparison
Immigrants from Venezuela
Poles
28.1%
SINGLE MOTHER POVERTY
95.8/ 100
METRIC RATING
107th/ 347
METRIC RANK
28.4%
SINGLE MOTHER POVERTY
90.8/ 100
METRIC RATING
127th/ 347
METRIC RANK
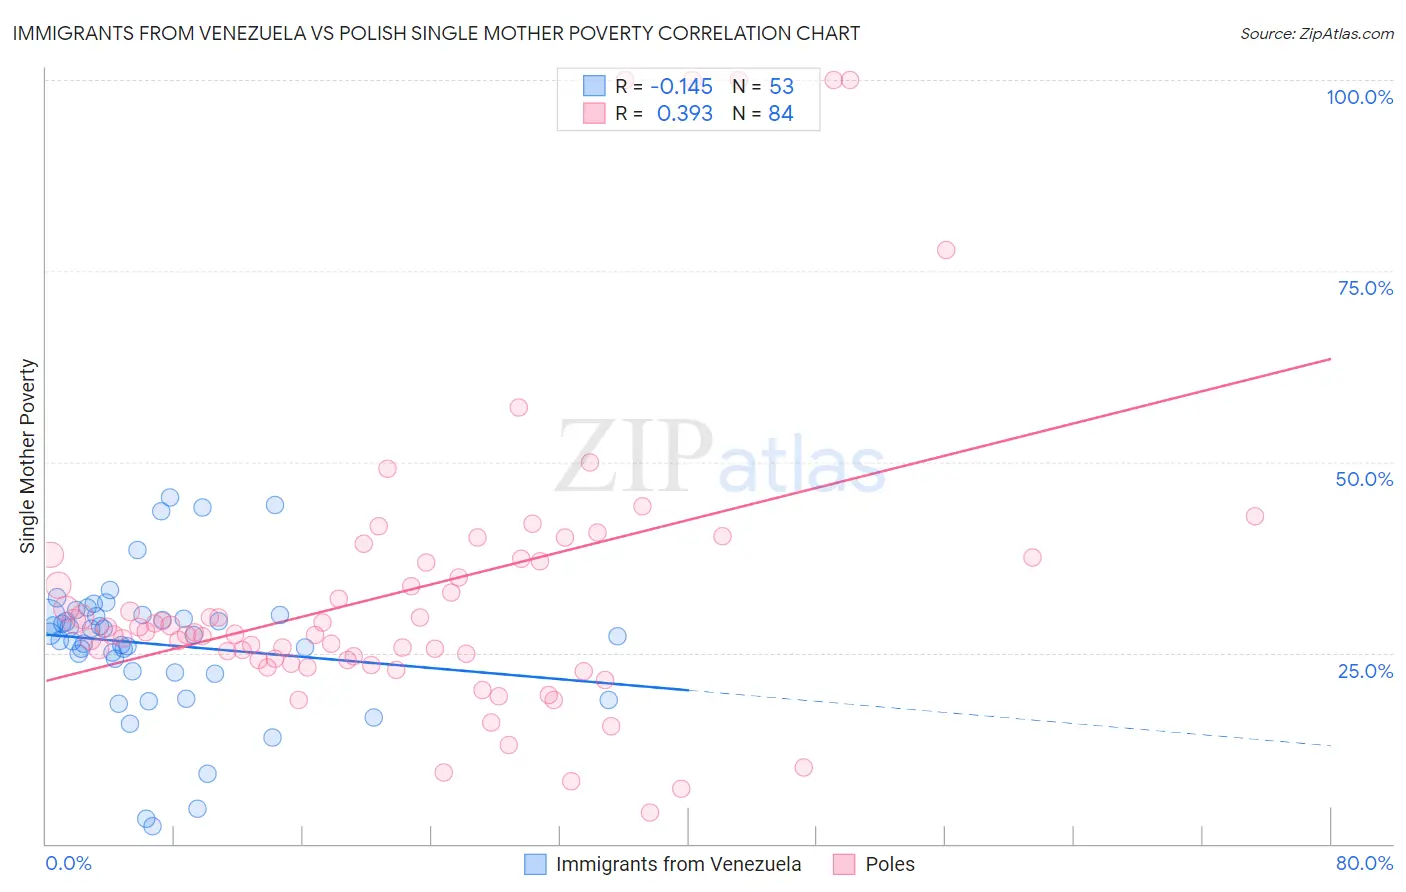
Immigrants from Venezuela vs Polish Single Mother Poverty Correlation Chart
The statistical analysis conducted on geographies consisting of 283,418,306 people shows a poor negative correlation between the proportion of Immigrants from Venezuela and poverty level among single mothers in the United States with a correlation coefficient (R) of -0.145 and weighted average of 28.1%. Similarly, the statistical analysis conducted on geographies consisting of 533,048,223 people shows a mild positive correlation between the proportion of Poles and poverty level among single mothers in the United States with a correlation coefficient (R) of 0.393 and weighted average of 28.4%, a difference of 1.0%.
Single Mother Poverty Correlation Summary
| Measurement | Immigrants from Venezuela | Polish |
| Minimum | 2.4% | 4.1% |
| Maximum | 45.4% | 100.0% |
| Range | 43.0% | 95.9% |
| Mean | 26.1% | 33.1% |
| Median | 27.3% | 27.7% |
| Interquartile 25% (IQ1) | 22.5% | 24.1% |
| Interquartile 75% (IQ3) | 29.9% | 37.2% |
| Interquartile Range (IQR) | 7.4% | 13.1% |
| Standard Deviation (Sample) | 9.0% | 20.1% |
| Standard Deviation (Population) | 9.0% | 20.0% |
Demographics Similar to Immigrants from Venezuela and Poles by Single Mother Poverty
In terms of single mother poverty, the demographic groups most similar to Immigrants from Venezuela are Immigrants from Zimbabwe (28.1%, a difference of 0.080%), Immigrants from Armenia (28.1%, a difference of 0.17%), Croatian (28.2%, a difference of 0.29%), Venezuelan (28.2%, a difference of 0.34%), and Immigrants from Kazakhstan (28.2%, a difference of 0.35%). Similarly, the demographic groups most similar to Poles are Immigrants from Chile (28.4%, a difference of 0.010%), Kenyan (28.4%, a difference of 0.020%), Uruguayan (28.3%, a difference of 0.14%), Immigrants from Switzerland (28.3%, a difference of 0.14%), and Colombian (28.3%, a difference of 0.15%).
| Demographics | Rating | Rank | Single Mother Poverty |
| Immigrants | Venezuela | 95.8 /100 | #107 | Exceptional 28.1% |
| Immigrants | Zimbabwe | 95.5 /100 | #108 | Exceptional 28.1% |
| Immigrants | Armenia | 95.2 /100 | #109 | Exceptional 28.1% |
| Croatians | 94.8 /100 | #110 | Exceptional 28.2% |
| Venezuelans | 94.5 /100 | #111 | Exceptional 28.2% |
| Immigrants | Kazakhstan | 94.5 /100 | #112 | Exceptional 28.2% |
| Immigrants | South Africa | 93.2 /100 | #113 | Exceptional 28.3% |
| Immigrants | Western Asia | 92.7 /100 | #114 | Exceptional 28.3% |
| Immigrants | Kuwait | 92.7 /100 | #115 | Exceptional 28.3% |
| Immigrants | Uganda | 92.5 /100 | #116 | Exceptional 28.3% |
| Australians | 92.5 /100 | #117 | Exceptional 28.3% |
| Brazilians | 92.4 /100 | #118 | Exceptional 28.3% |
| Immigrants | Syria | 92.4 /100 | #119 | Exceptional 28.3% |
| Cypriots | 92.3 /100 | #120 | Exceptional 28.3% |
| Immigrants | Afghanistan | 92.1 /100 | #121 | Exceptional 28.3% |
| Colombians | 91.8 /100 | #122 | Exceptional 28.3% |
| Uruguayans | 91.7 /100 | #123 | Exceptional 28.3% |
| Immigrants | Switzerland | 91.7 /100 | #124 | Exceptional 28.3% |
| Kenyans | 90.9 /100 | #125 | Exceptional 28.4% |
| Immigrants | Chile | 90.8 /100 | #126 | Exceptional 28.4% |
| Poles | 90.8 /100 | #127 | Exceptional 28.4% |