Immigrants from Bahamas vs Romanian Single Mother Poverty
COMPARE
Immigrants from Bahamas
Romanian
Single Mother Poverty
Single Mother Poverty Comparison
Immigrants from Bahamas
Romanians
31.1%
SINGLE MOTHER POVERTY
0.4/ 100
METRIC RATING
257th/ 347
METRIC RANK
27.8%
SINGLE MOTHER POVERTY
97.8/ 100
METRIC RATING
93rd/ 347
METRIC RANK
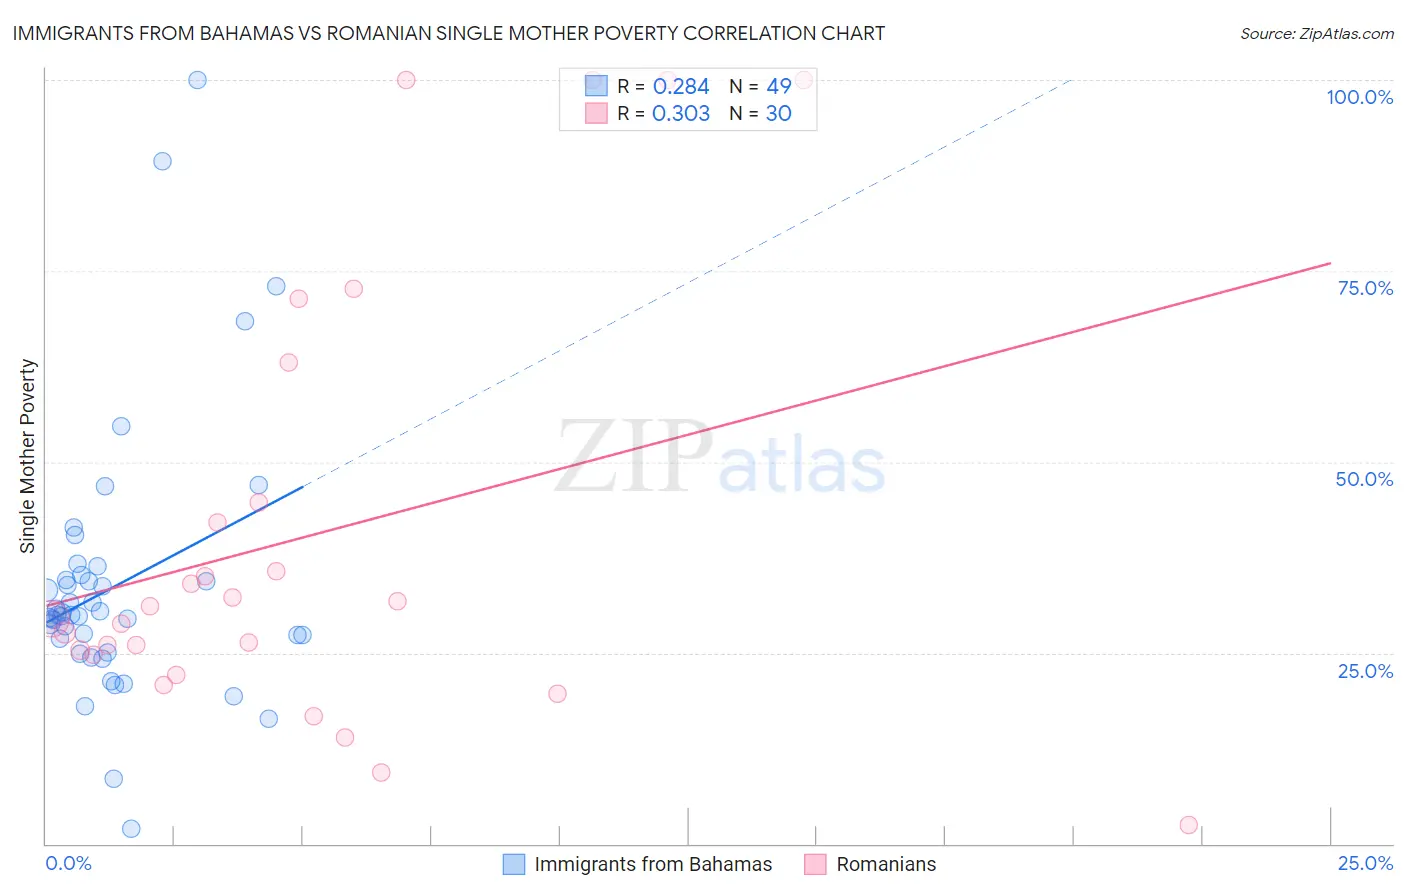
Immigrants from Bahamas vs Romanian Single Mother Poverty Correlation Chart
The statistical analysis conducted on geographies consisting of 104,190,848 people shows a weak positive correlation between the proportion of Immigrants from Bahamas and poverty level among single mothers in the United States with a correlation coefficient (R) of 0.284 and weighted average of 31.1%. Similarly, the statistical analysis conducted on geographies consisting of 367,510,657 people shows a mild positive correlation between the proportion of Romanians and poverty level among single mothers in the United States with a correlation coefficient (R) of 0.303 and weighted average of 27.8%, a difference of 11.7%.
Single Mother Poverty Correlation Summary
| Measurement | Immigrants from Bahamas | Romanian |
| Minimum | 2.0% | 2.5% |
| Maximum | 100.0% | 100.0% |
| Range | 98.0% | 97.5% |
| Mean | 33.8% | 40.4% |
| Median | 29.9% | 30.2% |
| Interquartile 25% (IQ1) | 26.0% | 24.8% |
| Interquartile 75% (IQ3) | 34.8% | 44.7% |
| Interquartile Range (IQR) | 8.9% | 19.9% |
| Standard Deviation (Sample) | 17.5% | 28.4% |
| Standard Deviation (Population) | 17.4% | 27.9% |
Similar Demographics by Single Mother Poverty
Demographics Similar to Immigrants from Bahamas by Single Mother Poverty
In terms of single mother poverty, the demographic groups most similar to Immigrants from Bahamas are Immigrants from West Indies (31.1%, a difference of 0.040%), Immigrants from Caribbean (31.1%, a difference of 0.090%), Immigrants from Bangladesh (31.1%, a difference of 0.12%), Belizean (31.0%, a difference of 0.26%), and White/Caucasian (31.2%, a difference of 0.28%).
| Demographics | Rating | Rank | Single Mother Poverty |
| Vietnamese | 0.7 /100 | #250 | Tragic 30.9% |
| Tlingit-Haida | 0.6 /100 | #251 | Tragic 30.9% |
| Alaska Natives | 0.6 /100 | #252 | Tragic 30.9% |
| Celtics | 0.6 /100 | #253 | Tragic 30.9% |
| Senegalese | 0.5 /100 | #254 | Tragic 31.0% |
| Belizeans | 0.5 /100 | #255 | Tragic 31.0% |
| Immigrants | West Indies | 0.4 /100 | #256 | Tragic 31.1% |
| Immigrants | Bahamas | 0.4 /100 | #257 | Tragic 31.1% |
| Immigrants | Caribbean | 0.4 /100 | #258 | Tragic 31.1% |
| Immigrants | Bangladesh | 0.4 /100 | #259 | Tragic 31.1% |
| Whites/Caucasians | 0.3 /100 | #260 | Tragic 31.2% |
| Immigrants | El Salvador | 0.3 /100 | #261 | Tragic 31.2% |
| Hmong | 0.3 /100 | #262 | Tragic 31.2% |
| Bahamians | 0.2 /100 | #263 | Tragic 31.3% |
| Immigrants | Ecuador | 0.2 /100 | #264 | Tragic 31.3% |
Demographics Similar to Romanians by Single Mother Poverty
In terms of single mother poverty, the demographic groups most similar to Romanians are Estonian (27.8%, a difference of 0.10%), Albanian (27.9%, a difference of 0.10%), Immigrants from Albania (27.8%, a difference of 0.12%), Chilean (27.9%, a difference of 0.13%), and Immigrants from Iraq (27.9%, a difference of 0.23%).
| Demographics | Rating | Rank | Single Mother Poverty |
| Immigrants | Ukraine | 98.6 /100 | #86 | Exceptional 27.7% |
| Afghans | 98.5 /100 | #87 | Exceptional 27.7% |
| Ethiopians | 98.4 /100 | #88 | Exceptional 27.7% |
| Immigrants | Ethiopia | 98.4 /100 | #89 | Exceptional 27.7% |
| Immigrants | France | 98.2 /100 | #90 | Exceptional 27.8% |
| Immigrants | Albania | 98.0 /100 | #91 | Exceptional 27.8% |
| Estonians | 97.9 /100 | #92 | Exceptional 27.8% |
| Romanians | 97.8 /100 | #93 | Exceptional 27.8% |
| Albanians | 97.6 /100 | #94 | Exceptional 27.9% |
| Chileans | 97.5 /100 | #95 | Exceptional 27.9% |
| Immigrants | Iraq | 97.3 /100 | #96 | Exceptional 27.9% |
| Immigrants | Brazil | 97.2 /100 | #97 | Exceptional 27.9% |
| Immigrants | Nepal | 97.2 /100 | #98 | Exceptional 27.9% |
| Immigrants | Netherlands | 97.2 /100 | #99 | Exceptional 27.9% |
| Zimbabweans | 97.1 /100 | #100 | Exceptional 27.9% |