Tsimshian vs Menominee Child Poverty Among Girls Under 16

COMPARE

Tsimshian
Race
Ancestry
AfghanAfricanAlaska NativeAlaskan AthabascanAlbanianAleutAlsatianAmericanApacheArabArapahoArgentineanArmenianAssyrian/Chaldean/SyriacAustralianAustrianBahamianBangladeshiBarbadianBasqueBelgianBelizeanBermudanBhutaneseBlackfeetBolivianBrazilianBritishBritish West IndianBulgarianBurmeseCajunCambodianCanadianCape VerdeanCarpatho RusynCelticCentral AmericanCentral American IndianCherokeeCheyenneChickasawChileanChineseChippewaChoctawColombianColvilleComancheCosta RicanCreeCreekCroatianCrowCubanCypriotCzechCzechoslovakianDanishDelawareDominicanDutchDutch West IndianEastern EuropeanEcuadorianEgyptianEnglishEstonianEthiopianEuropeanFijianFilipinoFinnishFrenchFrench American IndianFrench CanadianGermanGerman RussianGhanaianGreekGuamanian/ChamorroGuatemalanGuyaneseHaitianHmongHonduranHopiHoumaHungarianIcelanderIndian (Asian)IndonesianInupiatIranianIraqiIrishIroquoisIsraeliItalianJamaicanJapaneseJordanianKenyanKiowaKoreanLaotianLatvianLebaneseLiberianLithuanianLumbeeLuxembourgerMacedonianMalaysianMalteseMarshalleseMexicanMexican American IndianMongolianMoroccanNative HawaiianNavajoNepaleseNew ZealanderNicaraguanNigerianNorthern EuropeanNorwegianOkinawanOsageOttawaPaiutePakistaniPalestinianPanamanianParaguayanPennsylvania GermanPeruvianPimaPolishPortuguesePotawatomiPuebloPuerto RicanPuget Sound SalishRomanianRussianSalvadoranSamoanScandinavianScotch-IrishScottishSeminoleSenegaleseSerbianShoshoneSierra LeoneanSiouxSlavicSlovakSloveneSomaliSouth AfricanSouth AmericanSouth American IndianSoviet UnionSpaniardSpanishSpanish AmericanSpanish American IndianSri LankanSubsaharan AfricanSudaneseSwedishSwissSyrianTaiwaneseThaiTlingit-HaidaTohono O'OdhamTonganTrinidadian and TobagonianTsimshianTurkishU.S. Virgin IslanderUgandanUkrainianUruguayanUteVenezuelanVietnameseWelshWest IndianYakamaYaquiYugoslavianYumanYup'ikZimbabwean
Immigration
NonimmigrantsImmigrantsAfghanistanAfricaAlbaniaArgentinaArmeniaAsiaAustraliaAustriaBahamasBangladeshBarbadosBelarusBelgiumBelizeBoliviaBosnia and HerzegovinaBrazilBulgariaBurma/MyanmarCabo VerdeCambodiaCameroonCanadaCaribbeanCentral AmericaChileChinaColombiaCongoCosta RicaCroatiaCubaCzechoslovakiaDenmarkDominicaDominican RepublicEastern AfricaEastern AsiaEastern EuropeEcuadorEgyptEl SalvadorEnglandEritreaEthiopiaEuropeFijiFranceGermanyGhanaGreeceGrenadaGuatemalaGuyanaHaitiHondurasHong KongHungaryIndiaIndonesiaIranIraqIrelandIsraelItalyJamaicaJapanJordanKazakhstanKenyaKoreaKuwaitLaosLatin AmericaLatviaLebanonLiberiaLithuaniaMalaysiaMexicoMicronesiaMiddle AfricaMoldovaMoroccoNepalNetherlandsNicaraguaNigeriaNorth AmericaNorth MacedoniaNorthern AfricaNorthern EuropeNorwayOceaniaPakistanPanamaPeruPhilippinesPolandPortugalRomaniaRussiaSaudi ArabiaScotlandSenegalSerbiaSierra LeoneSingaporeSomaliaSouth AfricaSouth AmericaSouth Central AsiaSouth Eastern AsiaSouthern EuropeSpainSri LankaSt. Vincent and the GrenadinesSudanSwedenSwitzerlandSyriaTaiwanThailandTrinidad and TobagoTurkeyUgandaUkraineUruguayUzbekistanVenezuelaVietnamWest IndiesWestern AfricaWestern AsiaWestern EuropeYemenZaireZimbabweAzores
Menominee
Race
Ancestry
AfghanAfricanAlaska NativeAlaskan AthabascanAlbanianAleutAlsatianAmericanApacheArabArapahoArgentineanArmenianAssyrian/Chaldean/SyriacAustralianAustrianBahamianBangladeshiBarbadianBasqueBelgianBelizeanBermudanBhutaneseBlackfeetBolivianBrazilianBritishBritish West IndianBulgarianBurmeseCajunCambodianCanadianCape VerdeanCarpatho RusynCelticCentral AmericanCentral American IndianCherokeeCheyenneChickasawChileanChineseChippewaChoctawColombianColvilleComancheCosta RicanCreeCreekCroatianCrowCubanCypriotCzechCzechoslovakianDanishDelawareDominicanDutchDutch West IndianEastern EuropeanEcuadorianEgyptianEnglishEstonianEthiopianEuropeanFijianFilipinoFinnishFrenchFrench American IndianFrench CanadianGermanGerman RussianGhanaianGreekGuamanian/ChamorroGuatemalanGuyaneseHaitianHmongHonduranHopiHoumaHungarianIcelanderIndian (Asian)IndonesianInupiatIranianIraqiIrishIroquoisIsraeliItalianJamaicanJapaneseJordanianKenyanKiowaKoreanLaotianLatvianLebaneseLiberianLithuanianLumbeeLuxembourgerMacedonianMalaysianMalteseMarshalleseMenomineeMexicanMexican American IndianMongolianMoroccanNative HawaiianNavajoNepaleseNew ZealanderNicaraguanNigerianNorthern EuropeanNorwegianOkinawanOsageOttawaPaiutePakistaniPalestinianPanamanianParaguayanPennsylvania GermanPeruvianPimaPolishPortuguesePotawatomiPuebloPuerto RicanPuget Sound SalishRomanianRussianSalvadoranSamoanScandinavianScotch-IrishScottishSeminoleSenegaleseSerbianShoshoneSierra LeoneanSiouxSlavicSlovakSloveneSomaliSouth AfricanSouth AmericanSouth American IndianSoviet UnionSpaniardSpanishSpanish AmericanSpanish American IndianSri LankanSubsaharan AfricanSudaneseSwedishSwissSyrianTaiwaneseThaiTlingit-HaidaTohono O'OdhamTonganTrinidadian and TobagonianTurkishU.S. Virgin IslanderUgandanUkrainianUruguayanUteVenezuelanVietnameseWelshWest IndianYakamaYaquiYugoslavianYumanYup'ikZimbabwean
Immigration
NonimmigrantsImmigrantsAfghanistanAfricaAlbaniaArgentinaArmeniaAsiaAustraliaAustriaBahamasBangladeshBarbadosBelarusBelgiumBelizeBoliviaBosnia and HerzegovinaBrazilBulgariaBurma/MyanmarCabo VerdeCambodiaCameroonCanadaCaribbeanCentral AmericaChileChinaColombiaCongoCosta RicaCroatiaCubaCzechoslovakiaDenmarkDominicaDominican RepublicEastern AfricaEastern AsiaEastern EuropeEcuadorEgyptEl SalvadorEnglandEritreaEthiopiaEuropeFijiFranceGermanyGhanaGreeceGrenadaGuatemalaGuyanaHaitiHondurasHong KongHungaryIndiaIndonesiaIranIraqIrelandIsraelItalyJamaicaJapanJordanKazakhstanKenyaKoreaKuwaitLaosLatin AmericaLatviaLebanonLiberiaLithuaniaMalaysiaMexicoMicronesiaMiddle AfricaMoldovaMoroccoNepalNetherlandsNicaraguaNigeriaNorth AmericaNorth MacedoniaNorthern AfricaNorthern EuropeNorwayOceaniaPakistanPanamaPeruPhilippinesPolandPortugalRomaniaRussiaSaudi ArabiaScotlandSenegalSerbiaSierra LeoneSingaporeSomaliaSouth AfricaSouth AmericaSouth Central AsiaSouth Eastern AsiaSouthern EuropeSpainSri LankaSt. Vincent and the GrenadinesSudanSwedenSwitzerlandSyriaTaiwanThailandTrinidad and TobagoTurkeyUgandaUkraineUruguayUzbekistanVenezuelaVietnamWest IndiesWestern AfricaWestern AsiaWestern EuropeYemenZaireZimbabweAzores
Child Poverty Among Girls Under 16
Income
Poverty
Unemployment
Labor Participation
Family Structure
Vehicle Availability
Education Level
Disability

Child Poverty Among Girls Under 16 Comparison

Tsimshian

Menominee

Exceptional
Tragic
11.5%
CHILD POVERTY AMONG GIRLS UNDER 16
100.0/ 100
METRIC RATING
4th/ 347
METRIC RANK
25.0%
CHILD POVERTY AMONG GIRLS UNDER 16
0.0/ 100
METRIC RATING
334th/ 347
METRIC RANK

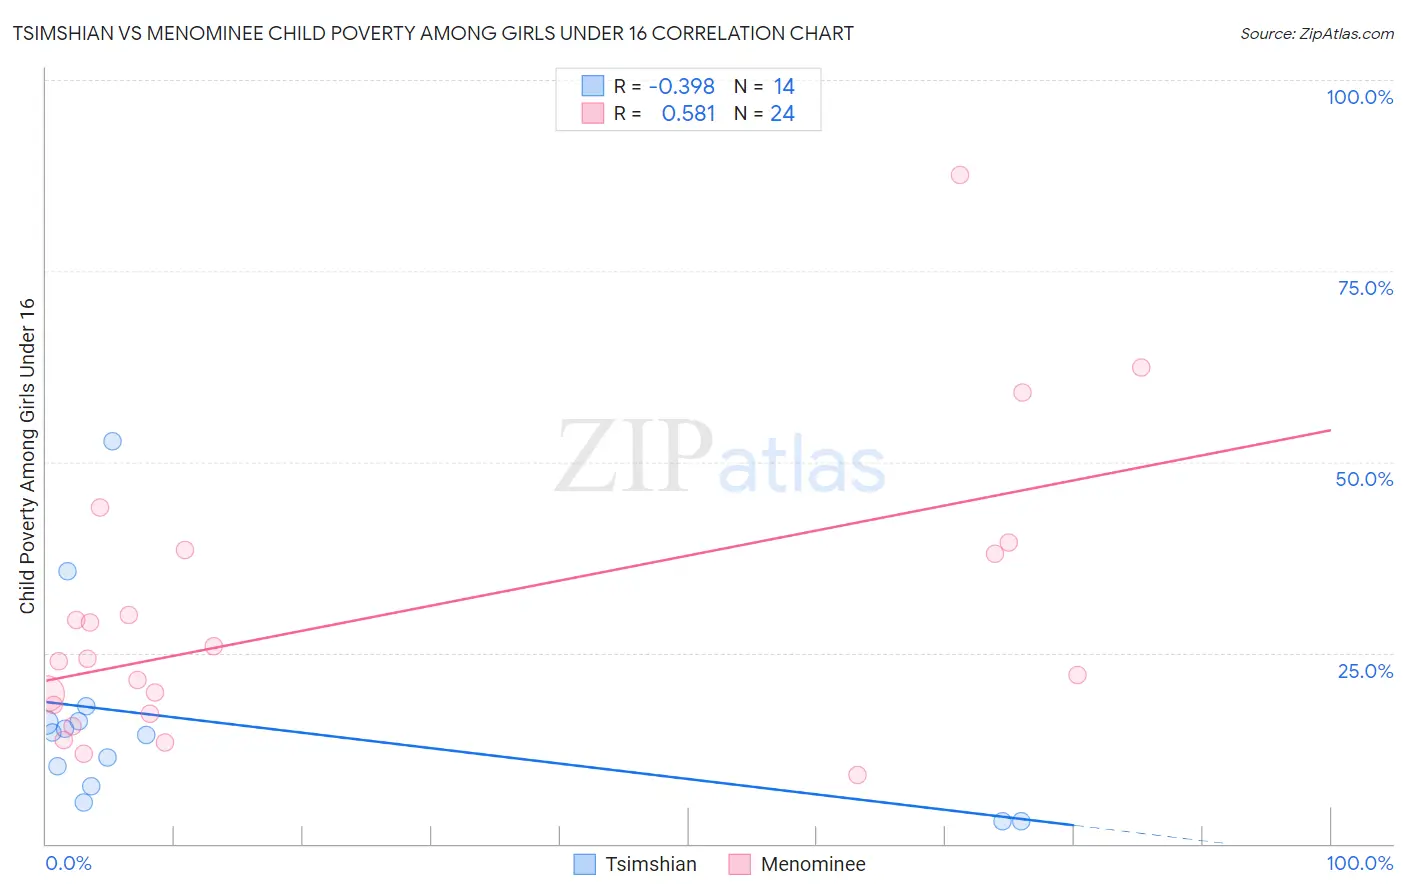
Tsimshian vs Menominee Child Poverty Among Girls Under 16 Correlation Chart

The statistical analysis conducted on geographies consisting of 15,575,613 people shows a mild negative correlation between the proportion of Tsimshian and poverty level among girls under the age of 16 in the United States with a correlation coefficient (R) of -0.398 and weighted average of 11.5%. Similarly, the statistical analysis conducted on geographies consisting of 45,532,886 people shows a substantial positive correlation between the proportion of Menominee and poverty level among girls under the age of 16 in the United States with a correlation coefficient (R) of 0.581 and weighted average of 25.0%, a difference of 118.1%.
Tsimshian vs Menominee Child Poverty Among Girls Under 16

Child Poverty Among Girls Under 16 Correlation Summary

MeasurementTsimshianMenominee
Minimum2.9%9.0%
Maximum52.6%87.5%
Range49.7%78.5%
Mean15.9%29.7%
Median14.4%24.1%
Interquartile 25% (IQ1)7.5%17.6%
Interquartile 75% (IQ3)16.1%38.2%
Interquartile Range (IQR)8.5%20.6%
Standard Deviation (Sample)13.4%18.5%
Standard Deviation (Population)12.9%18.1%

Similar Demographics by Child Poverty Among Girls Under 16

Demographics Similar to Tsimshian by Child Poverty Among Girls Under 16

In terms of child poverty among girls under 16, the demographic groups most similar to Tsimshian are Filipino (11.4%, a difference of 0.52%), Immigrants from Taiwan (11.3%, a difference of 1.4%), Thai (11.8%, a difference of 3.0%), Immigrants from India (11.0%, a difference of 4.1%), and Immigrants from Hong Kong (12.3%, a difference of 7.4%).
DemographicsRating | RankChild Poverty Among Girls Under 16
Immigrants | India
100.0
/100
|
#1
Exceptional
11.0%
Immigrants | Taiwan
100.0
/100
|
#2
Exceptional
11.3%
Filipinos
100.0
/100
|
#3
Exceptional
11.4%
Tsimshian
100.0
/100
|
#4
Exceptional
11.5%
Thais
100.0
/100
|
#5
Exceptional
11.8%
Immigrants | Hong Kong
100.0
/100
|
#6
Exceptional
12.3%
Chinese
100.0
/100
|
#7
Exceptional
12.3%
Iranians
100.0
/100
|
#8
Exceptional
12.4%
Immigrants | Singapore
100.0
/100
|
#9
Exceptional
12.5%
Immigrants | Iran
100.0
/100
|
#10
Exceptional
12.6%
Immigrants | South Central Asia
100.0
/100
|
#11
Exceptional
12.7%
Bhutanese
100.0
/100
|
#12
Exceptional
12.7%
Immigrants | Ireland
99.9
/100
|
#13
Exceptional
12.9%
Burmese
99.9
/100
|
#14
Exceptional
13.0%
Okinawans
99.9
/100
|
#15
Exceptional
13.0%

Demographics Similar to Menominee by Child Poverty Among Girls Under 16

In terms of child poverty among girls under 16, the demographic groups most similar to Menominee are Pueblo (25.2%, a difference of 0.70%), Black/African American (24.7%, a difference of 1.5%), Sioux (25.6%, a difference of 2.2%), Yup'ik (25.8%, a difference of 3.1%), and Native/Alaskan (24.0%, a difference of 4.1%).
DemographicsRating | RankChild Poverty Among Girls Under 16
Central American Indians
0.0
/100
|
#327
Tragic
22.8%
Dominicans
0.0
/100
|
#328
Tragic
23.7%
Kiowa
0.0
/100
|
#329
Tragic
23.7%
Immigrants | Dominican Republic
0.0
/100
|
#330
Tragic
23.8%
Apache
0.0
/100
|
#331
Tragic
23.8%
Natives/Alaskans
0.0
/100
|
#332
Tragic
24.0%
Blacks/African Americans
0.0
/100
|
#333
Tragic
24.7%
Menominee
0.0
/100
|
#334
Tragic
25.0%
Pueblo
0.0
/100
|
#335
Tragic
25.2%
Sioux
0.0
/100
|
#336
Tragic
25.6%
Yup'ik
0.0
/100
|
#337
Tragic
25.8%
Cheyenne
0.0
/100
|
#338
Tragic
26.3%
Crow
0.0
/100
|
#339
Tragic
26.4%
Yuman
0.0
/100
|
#340
Tragic
27.1%
Hopi
0.0
/100
|
#341
Tragic
27.9%