Immigrants from Kenya vs Menominee Child Poverty Among Girls Under 16
COMPARE
Immigrants from Kenya
Menominee
Child Poverty Among Girls Under 16
Child Poverty Among Girls Under 16 Comparison
Immigrants from Kenya
Menominee
17.2%
CHILD POVERTY AMONG GIRLS UNDER 16
17.8/ 100
METRIC RATING
201st/ 347
METRIC RANK
25.0%
CHILD POVERTY AMONG GIRLS UNDER 16
0.0/ 100
METRIC RATING
334th/ 347
METRIC RANK
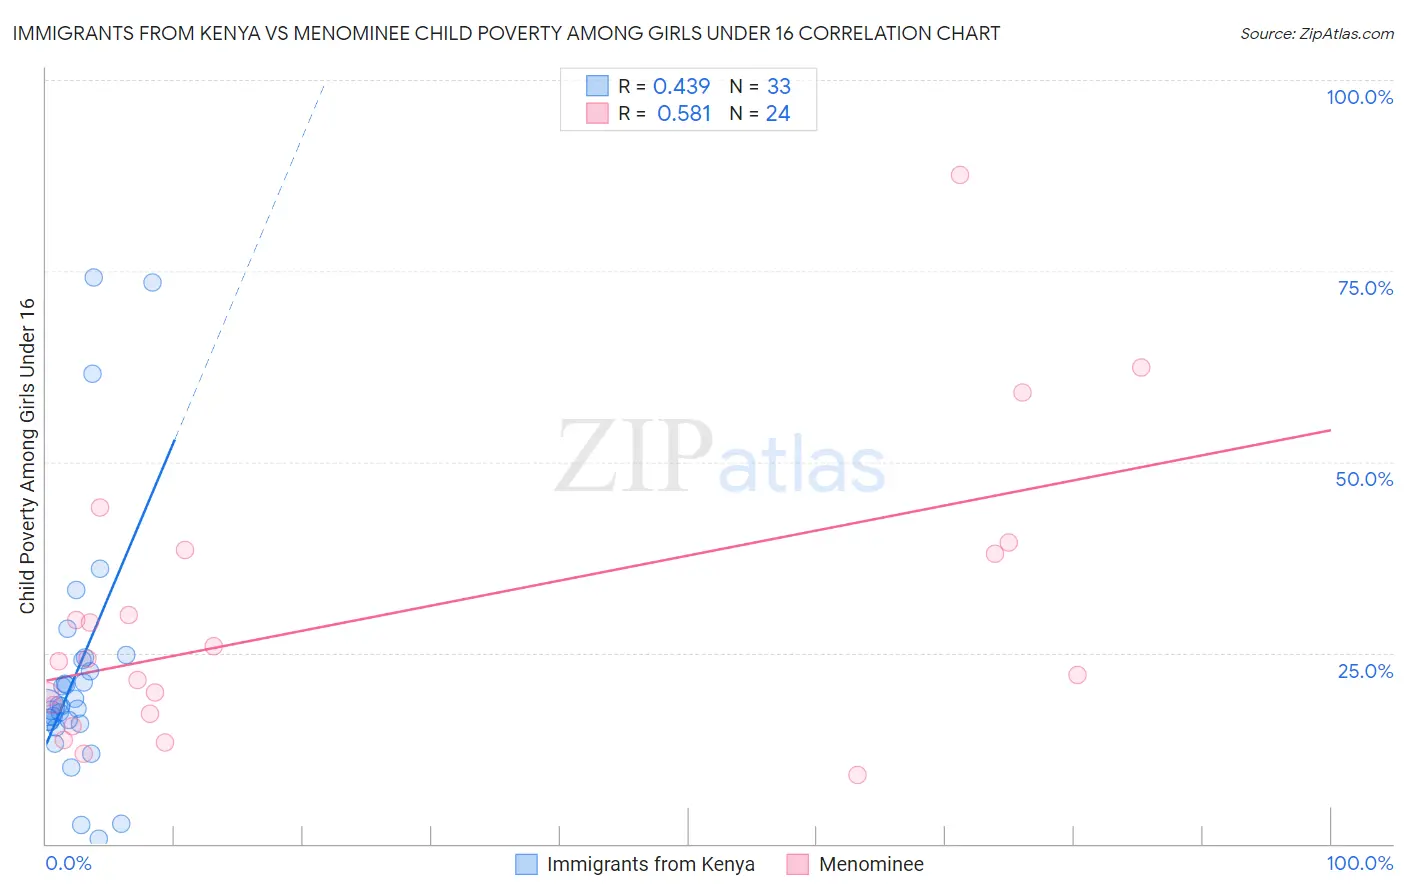
Immigrants from Kenya vs Menominee Child Poverty Among Girls Under 16 Correlation Chart
The statistical analysis conducted on geographies consisting of 216,258,173 people shows a moderate positive correlation between the proportion of Immigrants from Kenya and poverty level among girls under the age of 16 in the United States with a correlation coefficient (R) of 0.439 and weighted average of 17.2%. Similarly, the statistical analysis conducted on geographies consisting of 45,532,886 people shows a substantial positive correlation between the proportion of Menominee and poverty level among girls under the age of 16 in the United States with a correlation coefficient (R) of 0.581 and weighted average of 25.0%, a difference of 45.6%.
Child Poverty Among Girls Under 16 Correlation Summary
| Measurement | Immigrants from Kenya | Menominee |
| Minimum | 0.70% | 9.0% |
| Maximum | 74.2% | 87.5% |
| Range | 73.5% | 78.5% |
| Mean | 22.6% | 29.7% |
| Median | 18.0% | 24.1% |
| Interquartile 25% (IQ1) | 15.8% | 17.6% |
| Interquartile 75% (IQ3) | 24.2% | 38.2% |
| Interquartile Range (IQR) | 8.4% | 20.6% |
| Standard Deviation (Sample) | 16.9% | 18.5% |
| Standard Deviation (Population) | 16.7% | 18.1% |
Similar Demographics by Child Poverty Among Girls Under 16
Demographics Similar to Immigrants from Kenya by Child Poverty Among Girls Under 16
In terms of child poverty among girls under 16, the demographic groups most similar to Immigrants from Kenya are Immigrants from Sierra Leone (17.2%, a difference of 0.050%), Ugandan (17.2%, a difference of 0.060%), Immigrants from Uzbekistan (17.1%, a difference of 0.64%), Immigrants from Afghanistan (17.1%, a difference of 0.79%), and Immigrants from Lebanon (17.1%, a difference of 0.82%).
| Demographics | Rating | Rank | Child Poverty Among Girls Under 16 |
| Spanish | 28.6 /100 | #194 | Fair 16.9% |
| Immigrants | Costa Rica | 25.6 /100 | #195 | Fair 17.0% |
| Celtics | 25.2 /100 | #196 | Fair 17.0% |
| Spaniards | 24.9 /100 | #197 | Fair 17.0% |
| Immigrants | Lebanon | 22.6 /100 | #198 | Fair 17.1% |
| Immigrants | Afghanistan | 22.4 /100 | #199 | Fair 17.1% |
| Immigrants | Uzbekistan | 21.5 /100 | #200 | Fair 17.1% |
| Immigrants | Kenya | 17.8 /100 | #201 | Poor 17.2% |
| Immigrants | Sierra Leone | 17.6 /100 | #202 | Poor 17.2% |
| Ugandans | 17.5 /100 | #203 | Poor 17.2% |
| Iraqis | 13.0 /100 | #204 | Poor 17.4% |
| Immigrants | Cameroon | 12.6 /100 | #205 | Poor 17.4% |
| Delaware | 11.5 /100 | #206 | Poor 17.4% |
| Hmong | 10.6 /100 | #207 | Poor 17.5% |
| Sierra Leoneans | 8.9 /100 | #208 | Tragic 17.6% |
Demographics Similar to Menominee by Child Poverty Among Girls Under 16
In terms of child poverty among girls under 16, the demographic groups most similar to Menominee are Pueblo (25.2%, a difference of 0.70%), Black/African American (24.7%, a difference of 1.5%), Sioux (25.6%, a difference of 2.2%), Yup'ik (25.8%, a difference of 3.1%), and Native/Alaskan (24.0%, a difference of 4.1%).
| Demographics | Rating | Rank | Child Poverty Among Girls Under 16 |
| Central American Indians | 0.0 /100 | #327 | Tragic 22.8% |
| Dominicans | 0.0 /100 | #328 | Tragic 23.7% |
| Kiowa | 0.0 /100 | #329 | Tragic 23.7% |
| Immigrants | Dominican Republic | 0.0 /100 | #330 | Tragic 23.8% |
| Apache | 0.0 /100 | #331 | Tragic 23.8% |
| Natives/Alaskans | 0.0 /100 | #332 | Tragic 24.0% |
| Blacks/African Americans | 0.0 /100 | #333 | Tragic 24.7% |
| Menominee | 0.0 /100 | #334 | Tragic 25.0% |
| Pueblo | 0.0 /100 | #335 | Tragic 25.2% |
| Sioux | 0.0 /100 | #336 | Tragic 25.6% |
| Yup'ik | 0.0 /100 | #337 | Tragic 25.8% |
| Cheyenne | 0.0 /100 | #338 | Tragic 26.3% |
| Crow | 0.0 /100 | #339 | Tragic 26.4% |
| Yuman | 0.0 /100 | #340 | Tragic 27.1% |
| Hopi | 0.0 /100 | #341 | Tragic 27.9% |