Tsimshian vs Immigrants from Cuba Child Poverty Under the Age of 5
COMPARE
Tsimshian
Immigrants from Cuba
Child Poverty Under the Age of 5
Child Poverty Under the Age of 5 Comparison
Tsimshian
Immigrants from Cuba
14.7%
CHILD POVERTY UNDER THE AGE OF 5
99.6/ 100
METRIC RATING
46th/ 347
METRIC RANK
19.9%
CHILD POVERTY UNDER THE AGE OF 5
0.2/ 100
METRIC RATING
255th/ 347
METRIC RANK
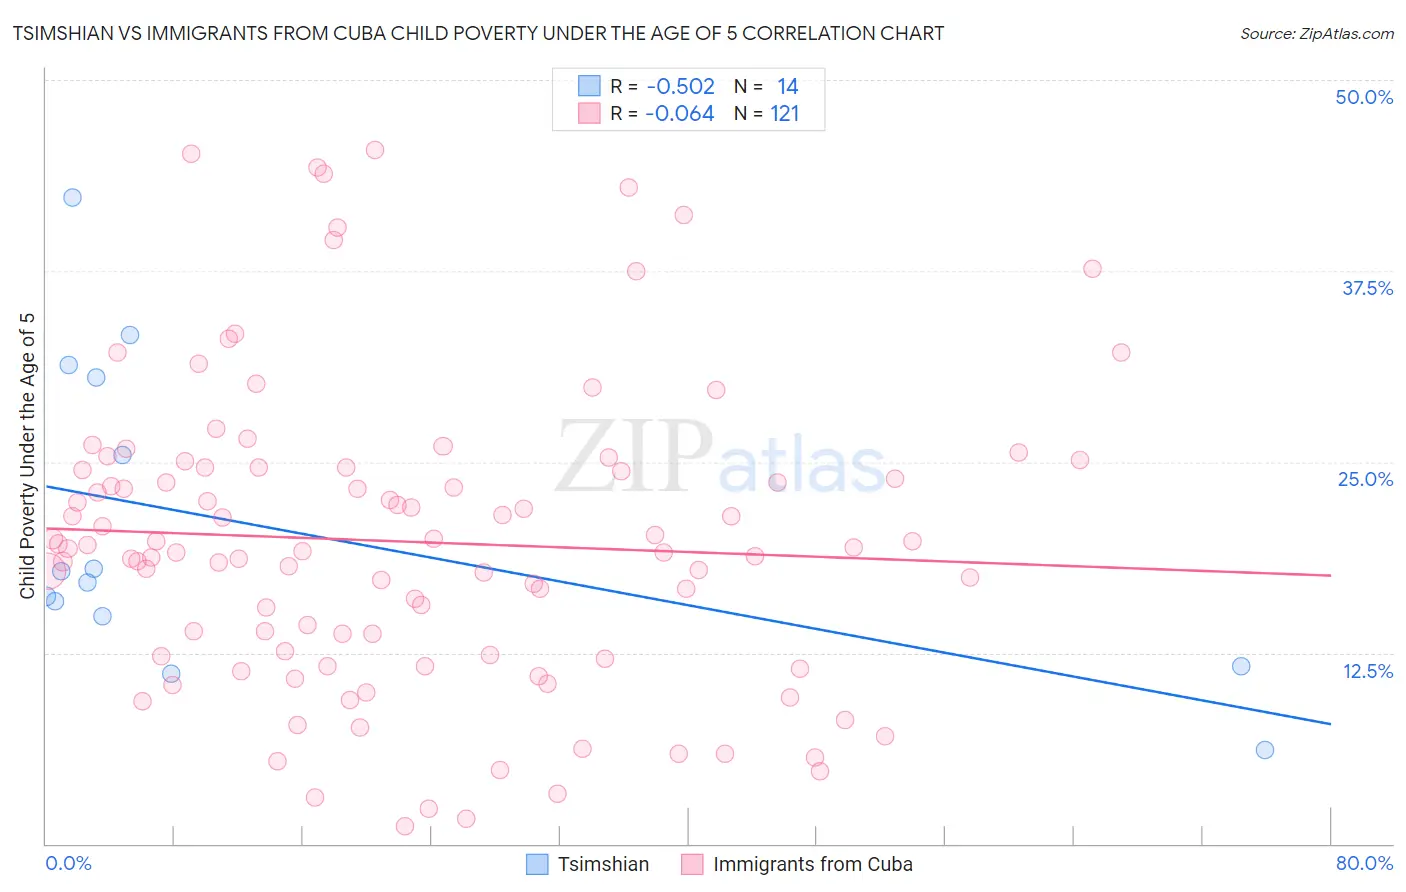
Tsimshian vs Immigrants from Cuba Child Poverty Under the Age of 5 Correlation Chart
The statistical analysis conducted on geographies consisting of 15,568,381 people shows a substantial negative correlation between the proportion of Tsimshian and poverty level among children under the age of 5 in the United States with a correlation coefficient (R) of -0.502 and weighted average of 14.7%. Similarly, the statistical analysis conducted on geographies consisting of 316,135,095 people shows a slight negative correlation between the proportion of Immigrants from Cuba and poverty level among children under the age of 5 in the United States with a correlation coefficient (R) of -0.064 and weighted average of 19.9%, a difference of 35.2%.
Child Poverty Under the Age of 5 Correlation Summary
| Measurement | Tsimshian | Immigrants from Cuba |
| Minimum | 6.2% | 1.1% |
| Maximum | 42.3% | 45.5% |
| Range | 36.2% | 44.3% |
| Mean | 20.8% | 19.8% |
| Median | 17.4% | 19.3% |
| Interquartile 25% (IQ1) | 14.9% | 12.3% |
| Interquartile 75% (IQ3) | 30.6% | 24.6% |
| Interquartile Range (IQR) | 15.6% | 12.3% |
| Standard Deviation (Sample) | 10.2% | 9.9% |
| Standard Deviation (Population) | 9.8% | 9.9% |
Similar Demographics by Child Poverty Under the Age of 5
Demographics Similar to Tsimshian by Child Poverty Under the Age of 5
In terms of child poverty under the age of 5, the demographic groups most similar to Tsimshian are Laotian (14.7%, a difference of 0.080%), Russian (14.8%, a difference of 0.14%), Immigrants from Philippines (14.7%, a difference of 0.20%), Immigrants from Czechoslovakia (14.8%, a difference of 0.24%), and Soviet Union (14.7%, a difference of 0.34%).
| Demographics | Rating | Rank | Child Poverty Under the Age of 5 |
| Norwegians | 99.7 /100 | #39 | Exceptional 14.6% |
| Immigrants | Australia | 99.7 /100 | #40 | Exceptional 14.6% |
| Immigrants | Belarus | 99.7 /100 | #41 | Exceptional 14.7% |
| Soviet Union | 99.7 /100 | #42 | Exceptional 14.7% |
| Immigrants | Greece | 99.7 /100 | #43 | Exceptional 14.7% |
| Immigrants | Philippines | 99.7 /100 | #44 | Exceptional 14.7% |
| Laotians | 99.6 /100 | #45 | Exceptional 14.7% |
| Tsimshian | 99.6 /100 | #46 | Exceptional 14.7% |
| Russians | 99.6 /100 | #47 | Exceptional 14.8% |
| Immigrants | Czechoslovakia | 99.6 /100 | #48 | Exceptional 14.8% |
| Immigrants | Bulgaria | 99.6 /100 | #49 | Exceptional 14.8% |
| Immigrants | Northern Europe | 99.6 /100 | #50 | Exceptional 14.8% |
| Estonians | 99.6 /100 | #51 | Exceptional 14.8% |
| Immigrants | Serbia | 99.5 /100 | #52 | Exceptional 14.9% |
| Luxembourgers | 99.4 /100 | #53 | Exceptional 14.9% |
Demographics Similar to Immigrants from Cuba by Child Poverty Under the Age of 5
In terms of child poverty under the age of 5, the demographic groups most similar to Immigrants from Cuba are Fijian (19.9%, a difference of 0.10%), Immigrants from Barbados (20.0%, a difference of 0.22%), Shoshone (20.0%, a difference of 0.23%), Mexican American Indian (19.9%, a difference of 0.25%), and Immigrants from St. Vincent and the Grenadines (20.0%, a difference of 0.37%).
| Demographics | Rating | Rank | Child Poverty Under the Age of 5 |
| Marshallese | 0.4 /100 | #248 | Tragic 19.7% |
| Immigrants | Middle Africa | 0.4 /100 | #249 | Tragic 19.7% |
| Immigrants | Nonimmigrants | 0.4 /100 | #250 | Tragic 19.7% |
| Pennsylvania Germans | 0.3 /100 | #251 | Tragic 19.8% |
| Immigrants | Nicaragua | 0.3 /100 | #252 | Tragic 19.8% |
| Mexican American Indians | 0.3 /100 | #253 | Tragic 19.9% |
| Fijians | 0.3 /100 | #254 | Tragic 19.9% |
| Immigrants | Cuba | 0.2 /100 | #255 | Tragic 19.9% |
| Immigrants | Barbados | 0.2 /100 | #256 | Tragic 20.0% |
| Shoshone | 0.2 /100 | #257 | Tragic 20.0% |
| Immigrants | St. Vincent and the Grenadines | 0.2 /100 | #258 | Tragic 20.0% |
| Immigrants | El Salvador | 0.2 /100 | #259 | Tragic 20.0% |
| Spanish Americans | 0.2 /100 | #260 | Tragic 20.1% |
| Immigrants | Bangladesh | 0.2 /100 | #261 | Tragic 20.1% |
| Liberians | 0.1 /100 | #262 | Tragic 20.2% |