Immigrants from Jordan vs Immigrants from Cuba Child Poverty Under the Age of 5
COMPARE
Immigrants from Jordan
Immigrants from Cuba
Child Poverty Under the Age of 5
Child Poverty Under the Age of 5 Comparison
Immigrants from Jordan
Immigrants from Cuba
16.1%
CHILD POVERTY UNDER THE AGE OF 5
93.2/ 100
METRIC RATING
119th/ 347
METRIC RANK
19.9%
CHILD POVERTY UNDER THE AGE OF 5
0.2/ 100
METRIC RATING
255th/ 347
METRIC RANK
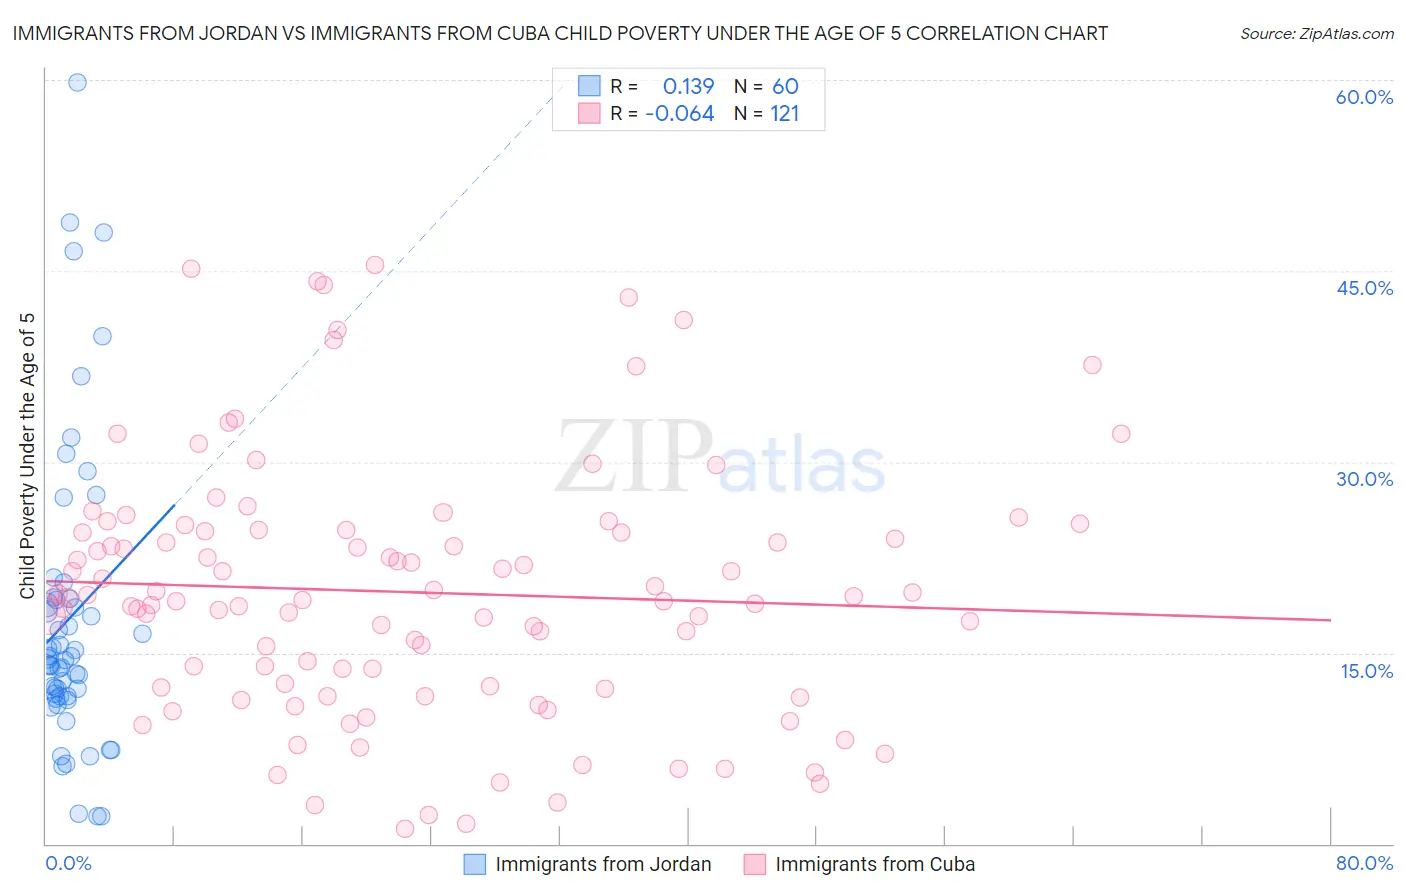
Immigrants from Jordan vs Immigrants from Cuba Child Poverty Under the Age of 5 Correlation Chart
The statistical analysis conducted on geographies consisting of 178,163,363 people shows a poor positive correlation between the proportion of Immigrants from Jordan and poverty level among children under the age of 5 in the United States with a correlation coefficient (R) of 0.139 and weighted average of 16.1%. Similarly, the statistical analysis conducted on geographies consisting of 316,135,095 people shows a slight negative correlation between the proportion of Immigrants from Cuba and poverty level among children under the age of 5 in the United States with a correlation coefficient (R) of -0.064 and weighted average of 19.9%, a difference of 24.0%.
Child Poverty Under the Age of 5 Correlation Summary
| Measurement | Immigrants from Jordan | Immigrants from Cuba |
| Minimum | 2.1% | 1.1% |
| Maximum | 59.8% | 45.5% |
| Range | 57.7% | 44.3% |
| Mean | 17.7% | 19.8% |
| Median | 14.5% | 19.3% |
| Interquartile 25% (IQ1) | 11.6% | 12.3% |
| Interquartile 75% (IQ3) | 19.2% | 24.6% |
| Interquartile Range (IQR) | 7.6% | 12.3% |
| Standard Deviation (Sample) | 11.8% | 9.9% |
| Standard Deviation (Population) | 11.7% | 9.9% |
Similar Demographics by Child Poverty Under the Age of 5
Demographics Similar to Immigrants from Jordan by Child Poverty Under the Age of 5
In terms of child poverty under the age of 5, the demographic groups most similar to Immigrants from Jordan are Basque (16.0%, a difference of 0.11%), Immigrants from Denmark (16.0%, a difference of 0.11%), Immigrants from Austria (16.0%, a difference of 0.13%), Immigrants from Peru (16.1%, a difference of 0.26%), and Mongolian (16.1%, a difference of 0.27%).
| Demographics | Rating | Rank | Child Poverty Under the Age of 5 |
| Peruvians | 94.1 /100 | #112 | Exceptional 16.0% |
| Puget Sound Salish | 94.1 /100 | #113 | Exceptional 16.0% |
| Immigrants | Kuwait | 93.9 /100 | #114 | Exceptional 16.0% |
| Albanians | 93.8 /100 | #115 | Exceptional 16.0% |
| Immigrants | Austria | 93.5 /100 | #116 | Exceptional 16.0% |
| Basques | 93.4 /100 | #117 | Exceptional 16.0% |
| Immigrants | Denmark | 93.4 /100 | #118 | Exceptional 16.0% |
| Immigrants | Jordan | 93.2 /100 | #119 | Exceptional 16.1% |
| Immigrants | Peru | 92.6 /100 | #120 | Exceptional 16.1% |
| Mongolians | 92.5 /100 | #121 | Exceptional 16.1% |
| Immigrants | Southern Europe | 92.0 /100 | #122 | Exceptional 16.1% |
| Austrians | 92.0 /100 | #123 | Exceptional 16.1% |
| Swiss | 92.0 /100 | #124 | Exceptional 16.1% |
| Native Hawaiians | 91.8 /100 | #125 | Exceptional 16.2% |
| Immigrants | Albania | 91.8 /100 | #126 | Exceptional 16.2% |
Demographics Similar to Immigrants from Cuba by Child Poverty Under the Age of 5
In terms of child poverty under the age of 5, the demographic groups most similar to Immigrants from Cuba are Fijian (19.9%, a difference of 0.10%), Immigrants from Barbados (20.0%, a difference of 0.22%), Shoshone (20.0%, a difference of 0.23%), Mexican American Indian (19.9%, a difference of 0.25%), and Immigrants from St. Vincent and the Grenadines (20.0%, a difference of 0.37%).
| Demographics | Rating | Rank | Child Poverty Under the Age of 5 |
| Marshallese | 0.4 /100 | #248 | Tragic 19.7% |
| Immigrants | Middle Africa | 0.4 /100 | #249 | Tragic 19.7% |
| Immigrants | Nonimmigrants | 0.4 /100 | #250 | Tragic 19.7% |
| Pennsylvania Germans | 0.3 /100 | #251 | Tragic 19.8% |
| Immigrants | Nicaragua | 0.3 /100 | #252 | Tragic 19.8% |
| Mexican American Indians | 0.3 /100 | #253 | Tragic 19.9% |
| Fijians | 0.3 /100 | #254 | Tragic 19.9% |
| Immigrants | Cuba | 0.2 /100 | #255 | Tragic 19.9% |
| Immigrants | Barbados | 0.2 /100 | #256 | Tragic 20.0% |
| Shoshone | 0.2 /100 | #257 | Tragic 20.0% |
| Immigrants | St. Vincent and the Grenadines | 0.2 /100 | #258 | Tragic 20.0% |
| Immigrants | El Salvador | 0.2 /100 | #259 | Tragic 20.0% |
| Spanish Americans | 0.2 /100 | #260 | Tragic 20.1% |
| Immigrants | Bangladesh | 0.2 /100 | #261 | Tragic 20.1% |
| Liberians | 0.1 /100 | #262 | Tragic 20.2% |