Tsimshian vs Immigrants from Canada Child Poverty Under the Age of 5
COMPARE
Tsimshian
Immigrants from Canada
Child Poverty Under the Age of 5
Child Poverty Under the Age of 5 Comparison
Tsimshian
Immigrants from Canada
14.7%
CHILD POVERTY UNDER THE AGE OF 5
99.6/ 100
METRIC RATING
46th/ 347
METRIC RANK
15.8%
CHILD POVERTY UNDER THE AGE OF 5
95.9/ 100
METRIC RATING
100th/ 347
METRIC RANK
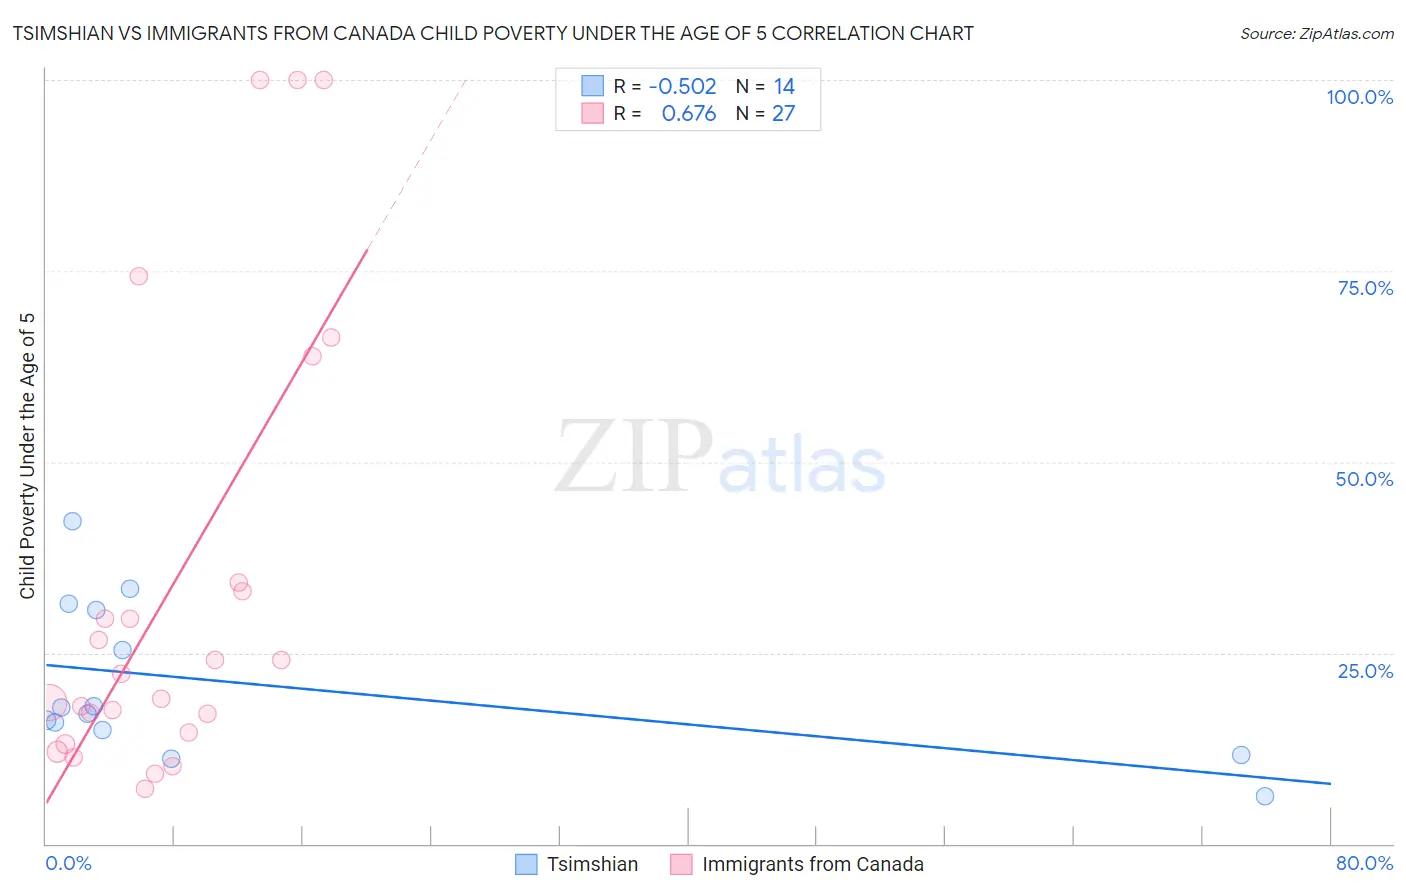
Tsimshian vs Immigrants from Canada Child Poverty Under the Age of 5 Correlation Chart
The statistical analysis conducted on geographies consisting of 15,568,381 people shows a substantial negative correlation between the proportion of Tsimshian and poverty level among children under the age of 5 in the United States with a correlation coefficient (R) of -0.502 and weighted average of 14.7%. Similarly, the statistical analysis conducted on geographies consisting of 434,512,181 people shows a significant positive correlation between the proportion of Immigrants from Canada and poverty level among children under the age of 5 in the United States with a correlation coefficient (R) of 0.676 and weighted average of 15.8%, a difference of 7.4%.
Child Poverty Under the Age of 5 Correlation Summary
| Measurement | Tsimshian | Immigrants from Canada |
| Minimum | 6.2% | 7.2% |
| Maximum | 42.3% | 100.0% |
| Range | 36.2% | 92.8% |
| Mean | 20.8% | 33.8% |
| Median | 17.4% | 22.3% |
| Interquartile 25% (IQ1) | 14.9% | 14.6% |
| Interquartile 75% (IQ3) | 30.6% | 34.1% |
| Interquartile Range (IQR) | 15.6% | 19.5% |
| Standard Deviation (Sample) | 10.2% | 29.3% |
| Standard Deviation (Population) | 9.8% | 28.8% |
Similar Demographics by Child Poverty Under the Age of 5
Demographics Similar to Tsimshian by Child Poverty Under the Age of 5
In terms of child poverty under the age of 5, the demographic groups most similar to Tsimshian are Laotian (14.7%, a difference of 0.080%), Russian (14.8%, a difference of 0.14%), Immigrants from Philippines (14.7%, a difference of 0.20%), Immigrants from Czechoslovakia (14.8%, a difference of 0.24%), and Soviet Union (14.7%, a difference of 0.34%).
| Demographics | Rating | Rank | Child Poverty Under the Age of 5 |
| Norwegians | 99.7 /100 | #39 | Exceptional 14.6% |
| Immigrants | Australia | 99.7 /100 | #40 | Exceptional 14.6% |
| Immigrants | Belarus | 99.7 /100 | #41 | Exceptional 14.7% |
| Soviet Union | 99.7 /100 | #42 | Exceptional 14.7% |
| Immigrants | Greece | 99.7 /100 | #43 | Exceptional 14.7% |
| Immigrants | Philippines | 99.7 /100 | #44 | Exceptional 14.7% |
| Laotians | 99.6 /100 | #45 | Exceptional 14.7% |
| Tsimshian | 99.6 /100 | #46 | Exceptional 14.7% |
| Russians | 99.6 /100 | #47 | Exceptional 14.8% |
| Immigrants | Czechoslovakia | 99.6 /100 | #48 | Exceptional 14.8% |
| Immigrants | Bulgaria | 99.6 /100 | #49 | Exceptional 14.8% |
| Immigrants | Northern Europe | 99.6 /100 | #50 | Exceptional 14.8% |
| Estonians | 99.6 /100 | #51 | Exceptional 14.8% |
| Immigrants | Serbia | 99.5 /100 | #52 | Exceptional 14.9% |
| Luxembourgers | 99.4 /100 | #53 | Exceptional 14.9% |
Demographics Similar to Immigrants from Canada by Child Poverty Under the Age of 5
In terms of child poverty under the age of 5, the demographic groups most similar to Immigrants from Canada are Palestinian (15.8%, a difference of 0.010%), Immigrants from Zimbabwe (15.8%, a difference of 0.010%), Immigrants from South Africa (15.8%, a difference of 0.13%), Armenian (15.8%, a difference of 0.14%), and Macedonian (15.8%, a difference of 0.20%).
| Demographics | Rating | Rank | Child Poverty Under the Age of 5 |
| Ukrainians | 97.1 /100 | #93 | Exceptional 15.7% |
| Immigrants | South Eastern Asia | 97.1 /100 | #94 | Exceptional 15.7% |
| Immigrants | Switzerland | 96.4 /100 | #95 | Exceptional 15.8% |
| Immigrants | Kazakhstan | 96.2 /100 | #96 | Exceptional 15.8% |
| Macedonians | 96.2 /100 | #97 | Exceptional 15.8% |
| Immigrants | South Africa | 96.1 /100 | #98 | Exceptional 15.8% |
| Palestinians | 95.9 /100 | #99 | Exceptional 15.8% |
| Immigrants | Canada | 95.9 /100 | #100 | Exceptional 15.8% |
| Immigrants | Zimbabwe | 95.9 /100 | #101 | Exceptional 15.8% |
| Armenians | 95.7 /100 | #102 | Exceptional 15.8% |
| Europeans | 95.3 /100 | #103 | Exceptional 15.9% |
| Immigrants | North America | 94.9 /100 | #104 | Exceptional 15.9% |
| Immigrants | Spain | 94.8 /100 | #105 | Exceptional 15.9% |
| Tlingit-Haida | 94.7 /100 | #106 | Exceptional 15.9% |
| Slovenes | 94.4 /100 | #107 | Exceptional 16.0% |