Tsimshian vs Belizean Child Poverty Under the Age of 5
COMPARE
Tsimshian
Belizean
Child Poverty Under the Age of 5
Child Poverty Under the Age of 5 Comparison
Tsimshian
Belizeans
14.7%
CHILD POVERTY UNDER THE AGE OF 5
99.6/ 100
METRIC RATING
46th/ 347
METRIC RANK
20.3%
CHILD POVERTY UNDER THE AGE OF 5
0.1/ 100
METRIC RATING
268th/ 347
METRIC RANK
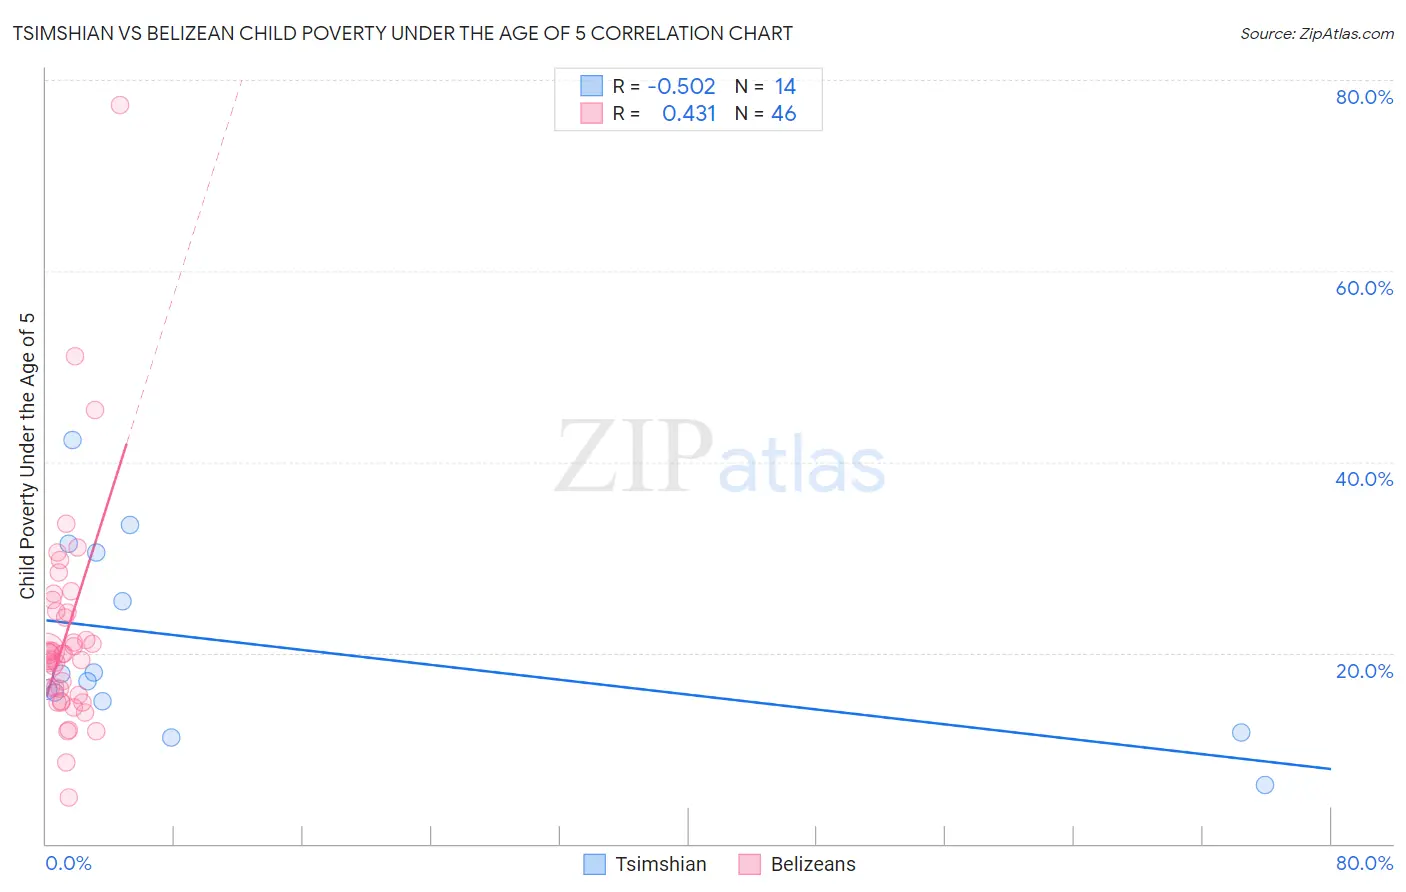
Tsimshian vs Belizean Child Poverty Under the Age of 5 Correlation Chart
The statistical analysis conducted on geographies consisting of 15,568,381 people shows a substantial negative correlation between the proportion of Tsimshian and poverty level among children under the age of 5 in the United States with a correlation coefficient (R) of -0.502 and weighted average of 14.7%. Similarly, the statistical analysis conducted on geographies consisting of 142,931,815 people shows a moderate positive correlation between the proportion of Belizeans and poverty level among children under the age of 5 in the United States with a correlation coefficient (R) of 0.431 and weighted average of 20.3%, a difference of 38.1%.
Child Poverty Under the Age of 5 Correlation Summary
| Measurement | Tsimshian | Belizean |
| Minimum | 6.2% | 4.8% |
| Maximum | 42.3% | 77.4% |
| Range | 36.2% | 72.6% |
| Mean | 20.8% | 22.1% |
| Median | 17.4% | 19.9% |
| Interquartile 25% (IQ1) | 14.9% | 15.6% |
| Interquartile 75% (IQ3) | 30.6% | 24.3% |
| Interquartile Range (IQR) | 15.6% | 8.7% |
| Standard Deviation (Sample) | 10.2% | 11.8% |
| Standard Deviation (Population) | 9.8% | 11.7% |
Similar Demographics by Child Poverty Under the Age of 5
Demographics Similar to Tsimshian by Child Poverty Under the Age of 5
In terms of child poverty under the age of 5, the demographic groups most similar to Tsimshian are Laotian (14.7%, a difference of 0.080%), Russian (14.8%, a difference of 0.14%), Immigrants from Philippines (14.7%, a difference of 0.20%), Immigrants from Czechoslovakia (14.8%, a difference of 0.24%), and Soviet Union (14.7%, a difference of 0.34%).
| Demographics | Rating | Rank | Child Poverty Under the Age of 5 |
| Norwegians | 99.7 /100 | #39 | Exceptional 14.6% |
| Immigrants | Australia | 99.7 /100 | #40 | Exceptional 14.6% |
| Immigrants | Belarus | 99.7 /100 | #41 | Exceptional 14.7% |
| Soviet Union | 99.7 /100 | #42 | Exceptional 14.7% |
| Immigrants | Greece | 99.7 /100 | #43 | Exceptional 14.7% |
| Immigrants | Philippines | 99.7 /100 | #44 | Exceptional 14.7% |
| Laotians | 99.6 /100 | #45 | Exceptional 14.7% |
| Tsimshian | 99.6 /100 | #46 | Exceptional 14.7% |
| Russians | 99.6 /100 | #47 | Exceptional 14.8% |
| Immigrants | Czechoslovakia | 99.6 /100 | #48 | Exceptional 14.8% |
| Immigrants | Bulgaria | 99.6 /100 | #49 | Exceptional 14.8% |
| Immigrants | Northern Europe | 99.6 /100 | #50 | Exceptional 14.8% |
| Estonians | 99.6 /100 | #51 | Exceptional 14.8% |
| Immigrants | Serbia | 99.5 /100 | #52 | Exceptional 14.9% |
| Luxembourgers | 99.4 /100 | #53 | Exceptional 14.9% |
Demographics Similar to Belizeans by Child Poverty Under the Age of 5
In terms of child poverty under the age of 5, the demographic groups most similar to Belizeans are Ottawa (20.3%, a difference of 0.0%), Immigrants from Burma/Myanmar (20.4%, a difference of 0.090%), Jamaican (20.4%, a difference of 0.16%), Aleut (20.3%, a difference of 0.40%), and Spanish American Indian (20.2%, a difference of 0.52%).
| Demographics | Rating | Rank | Child Poverty Under the Age of 5 |
| Immigrants | Bangladesh | 0.2 /100 | #261 | Tragic 20.1% |
| Liberians | 0.1 /100 | #262 | Tragic 20.2% |
| Barbadians | 0.1 /100 | #263 | Tragic 20.2% |
| Immigrants | Liberia | 0.1 /100 | #264 | Tragic 20.2% |
| Spanish American Indians | 0.1 /100 | #265 | Tragic 20.2% |
| Aleuts | 0.1 /100 | #266 | Tragic 20.3% |
| Ottawa | 0.1 /100 | #267 | Tragic 20.3% |
| Belizeans | 0.1 /100 | #268 | Tragic 20.3% |
| Immigrants | Burma/Myanmar | 0.1 /100 | #269 | Tragic 20.4% |
| Jamaicans | 0.1 /100 | #270 | Tragic 20.4% |
| Americans | 0.1 /100 | #271 | Tragic 20.5% |
| Immigrants | Jamaica | 0.1 /100 | #272 | Tragic 20.5% |
| Central Americans | 0.1 /100 | #273 | Tragic 20.6% |
| Immigrants | Belize | 0.1 /100 | #274 | Tragic 20.6% |
| Bangladeshis | 0.1 /100 | #275 | Tragic 20.6% |