Yup'ik vs Immigrants from Canada Child Poverty Under the Age of 5
COMPARE
Yup'ik
Immigrants from Canada
Child Poverty Under the Age of 5
Child Poverty Under the Age of 5 Comparison
Yup'ik
Immigrants from Canada
27.7%
CHILD POVERTY UNDER THE AGE OF 5
0.0/ 100
METRIC RATING
339th/ 347
METRIC RANK
15.8%
CHILD POVERTY UNDER THE AGE OF 5
95.9/ 100
METRIC RATING
100th/ 347
METRIC RANK
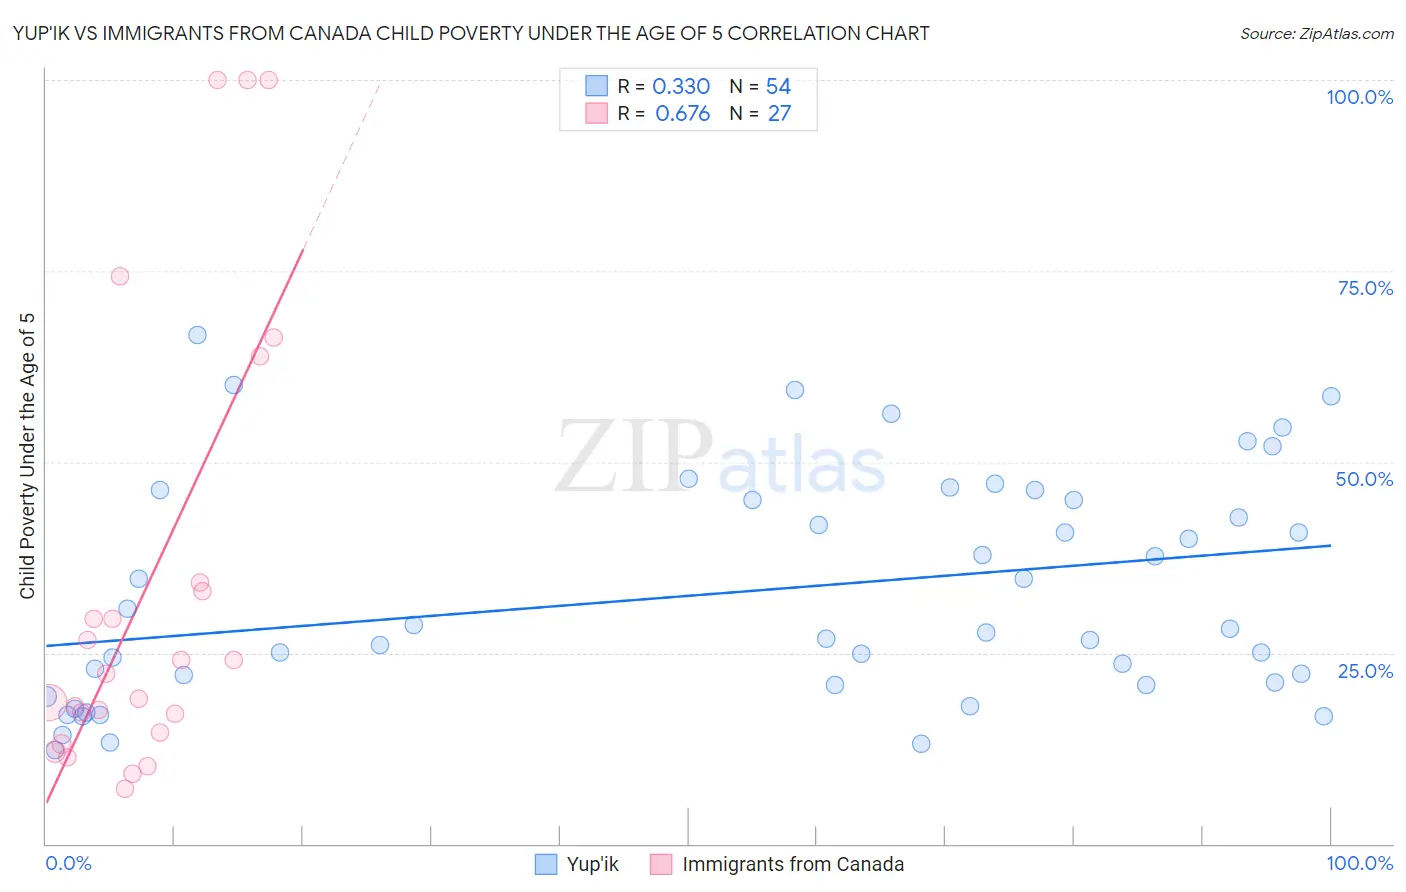
Yup'ik vs Immigrants from Canada Child Poverty Under the Age of 5 Correlation Chart
The statistical analysis conducted on geographies consisting of 39,533,777 people shows a mild positive correlation between the proportion of Yup'ik and poverty level among children under the age of 5 in the United States with a correlation coefficient (R) of 0.330 and weighted average of 27.7%. Similarly, the statistical analysis conducted on geographies consisting of 434,512,181 people shows a significant positive correlation between the proportion of Immigrants from Canada and poverty level among children under the age of 5 in the United States with a correlation coefficient (R) of 0.676 and weighted average of 15.8%, a difference of 75.2%.
Child Poverty Under the Age of 5 Correlation Summary
| Measurement | Yup'ik | Immigrants from Canada |
| Minimum | 12.3% | 7.2% |
| Maximum | 66.7% | 100.0% |
| Range | 54.4% | 92.8% |
| Mean | 32.9% | 33.8% |
| Median | 27.8% | 22.3% |
| Interquartile 25% (IQ1) | 20.8% | 14.6% |
| Interquartile 75% (IQ3) | 45.0% | 34.1% |
| Interquartile Range (IQR) | 24.2% | 19.5% |
| Standard Deviation (Sample) | 14.7% | 29.3% |
| Standard Deviation (Population) | 14.6% | 28.8% |
Similar Demographics by Child Poverty Under the Age of 5
Demographics Similar to Yup'ik by Child Poverty Under the Age of 5
In terms of child poverty under the age of 5, the demographic groups most similar to Yup'ik are Hopi (27.7%, a difference of 0.070%), Pima (27.4%, a difference of 1.1%), Cheyenne (28.3%, a difference of 2.2%), Sioux (26.9%, a difference of 3.0%), and Immigrants from Yemen (29.3%, a difference of 5.7%).
| Demographics | Rating | Rank | Child Poverty Under the Age of 5 |
| Apache | 0.0 /100 | #332 | Tragic 25.0% |
| Natives/Alaskans | 0.0 /100 | #333 | Tragic 25.6% |
| Blacks/African Americans | 0.0 /100 | #334 | Tragic 25.7% |
| Colville | 0.0 /100 | #335 | Tragic 25.7% |
| Sioux | 0.0 /100 | #336 | Tragic 26.9% |
| Pima | 0.0 /100 | #337 | Tragic 27.4% |
| Hopi | 0.0 /100 | #338 | Tragic 27.7% |
| Yup'ik | 0.0 /100 | #339 | Tragic 27.7% |
| Cheyenne | 0.0 /100 | #340 | Tragic 28.3% |
| Immigrants | Yemen | 0.0 /100 | #341 | Tragic 29.3% |
| Tohono O'odham | 0.0 /100 | #342 | Tragic 29.5% |
| Yuman | 0.0 /100 | #343 | Tragic 29.5% |
| Crow | 0.0 /100 | #344 | Tragic 31.0% |
| Navajo | 0.0 /100 | #345 | Tragic 31.6% |
| Lumbee | 0.0 /100 | #346 | Tragic 33.3% |
Demographics Similar to Immigrants from Canada by Child Poverty Under the Age of 5
In terms of child poverty under the age of 5, the demographic groups most similar to Immigrants from Canada are Palestinian (15.8%, a difference of 0.010%), Immigrants from Zimbabwe (15.8%, a difference of 0.010%), Immigrants from South Africa (15.8%, a difference of 0.13%), Armenian (15.8%, a difference of 0.14%), and Macedonian (15.8%, a difference of 0.20%).
| Demographics | Rating | Rank | Child Poverty Under the Age of 5 |
| Ukrainians | 97.1 /100 | #93 | Exceptional 15.7% |
| Immigrants | South Eastern Asia | 97.1 /100 | #94 | Exceptional 15.7% |
| Immigrants | Switzerland | 96.4 /100 | #95 | Exceptional 15.8% |
| Immigrants | Kazakhstan | 96.2 /100 | #96 | Exceptional 15.8% |
| Macedonians | 96.2 /100 | #97 | Exceptional 15.8% |
| Immigrants | South Africa | 96.1 /100 | #98 | Exceptional 15.8% |
| Palestinians | 95.9 /100 | #99 | Exceptional 15.8% |
| Immigrants | Canada | 95.9 /100 | #100 | Exceptional 15.8% |
| Immigrants | Zimbabwe | 95.9 /100 | #101 | Exceptional 15.8% |
| Armenians | 95.7 /100 | #102 | Exceptional 15.8% |
| Europeans | 95.3 /100 | #103 | Exceptional 15.9% |
| Immigrants | North America | 94.9 /100 | #104 | Exceptional 15.9% |
| Immigrants | Spain | 94.8 /100 | #105 | Exceptional 15.9% |
| Tlingit-Haida | 94.7 /100 | #106 | Exceptional 15.9% |
| Slovenes | 94.4 /100 | #107 | Exceptional 16.0% |