Immigrants from Africa vs Immigrants from Sweden Single Male Poverty
COMPARE
Immigrants from Africa
Immigrants from Sweden
Single Male Poverty
Single Male Poverty Comparison
Immigrants from Africa
Immigrants from Sweden
12.7%
SINGLE MALE POVERTY
63.4/ 100
METRIC RATING
161st/ 347
METRIC RANK
12.2%
SINGLE MALE POVERTY
97.5/ 100
METRIC RATING
96th/ 347
METRIC RANK
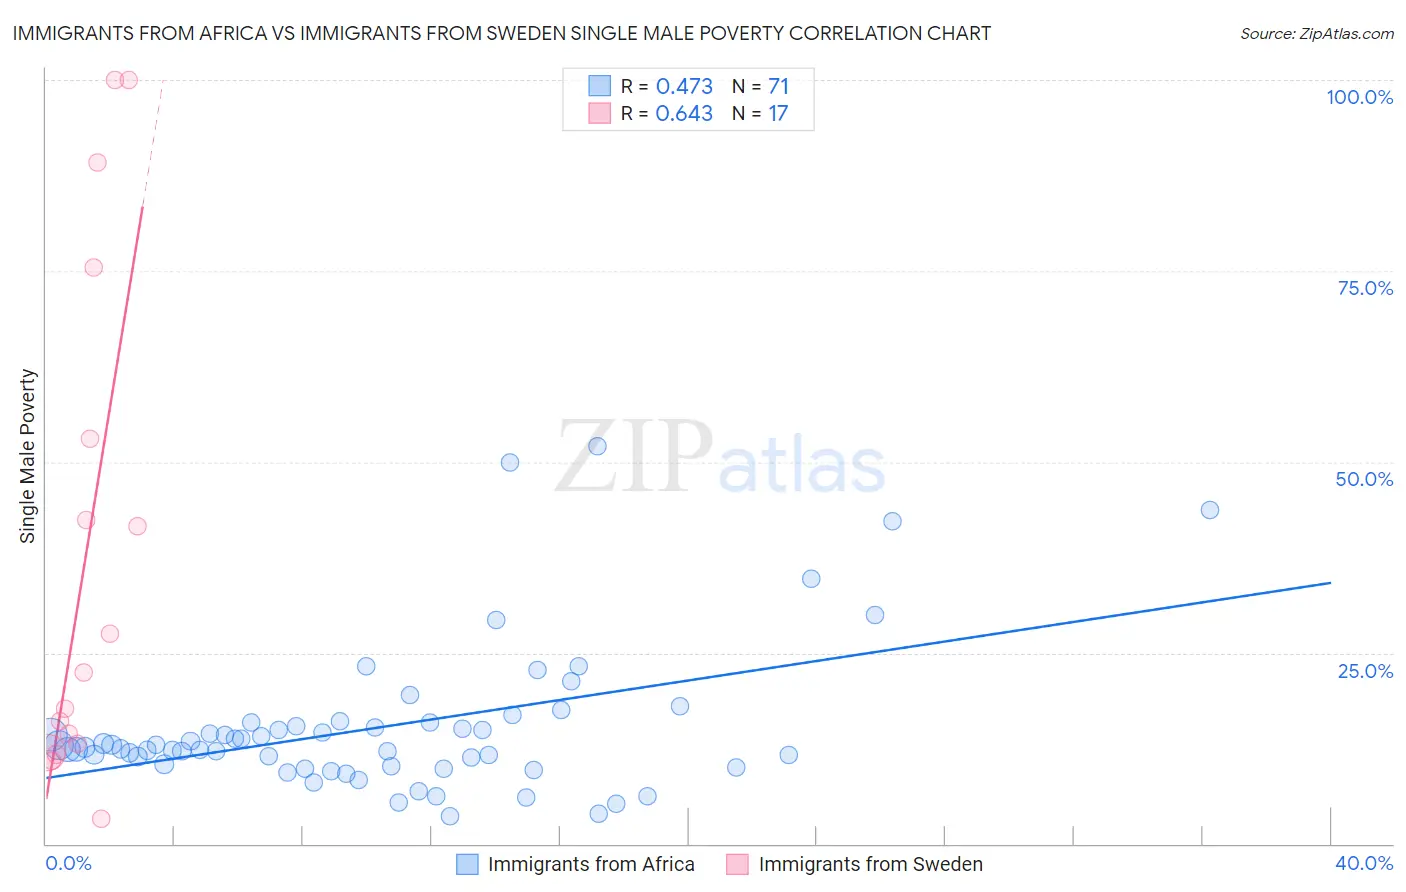
Immigrants from Africa vs Immigrants from Sweden Single Male Poverty Correlation Chart
The statistical analysis conducted on geographies consisting of 408,321,289 people shows a moderate positive correlation between the proportion of Immigrants from Africa and poverty level among single males in the United States with a correlation coefficient (R) of 0.473 and weighted average of 12.7%. Similarly, the statistical analysis conducted on geographies consisting of 151,415,814 people shows a significant positive correlation between the proportion of Immigrants from Sweden and poverty level among single males in the United States with a correlation coefficient (R) of 0.643 and weighted average of 12.2%, a difference of 4.3%.
Single Male Poverty Correlation Summary
| Measurement | Immigrants from Africa | Immigrants from Sweden |
| Minimum | 3.6% | 3.3% |
| Maximum | 52.0% | 100.0% |
| Range | 48.4% | 96.7% |
| Mean | 15.3% | 38.3% |
| Median | 12.6% | 22.4% |
| Interquartile 25% (IQ1) | 10.1% | 12.5% |
| Interquartile 75% (IQ3) | 15.8% | 64.3% |
| Interquartile Range (IQR) | 5.7% | 51.7% |
| Standard Deviation (Sample) | 9.6% | 33.3% |
| Standard Deviation (Population) | 9.6% | 32.3% |
Similar Demographics by Single Male Poverty
Demographics Similar to Immigrants from Africa by Single Male Poverty
In terms of single male poverty, the demographic groups most similar to Immigrants from Africa are Eastern European (12.7%, a difference of 0.010%), Palestinian (12.7%, a difference of 0.020%), Immigrants from Nigeria (12.7%, a difference of 0.030%), Immigrants from Liberia (12.7%, a difference of 0.040%), and Greek (12.7%, a difference of 0.040%).
| Demographics | Rating | Rank | Single Male Poverty |
| Immigrants | Scotland | 68.9 /100 | #154 | Good 12.7% |
| Immigrants | Spain | 68.7 /100 | #155 | Good 12.7% |
| Vietnamese | 67.9 /100 | #156 | Good 12.7% |
| Latvians | 67.9 /100 | #157 | Good 12.7% |
| Immigrants | Middle Africa | 64.9 /100 | #158 | Good 12.7% |
| Immigrants | Liberia | 64.2 /100 | #159 | Good 12.7% |
| Greeks | 64.1 /100 | #160 | Good 12.7% |
| Immigrants | Africa | 63.4 /100 | #161 | Good 12.7% |
| Eastern Europeans | 63.3 /100 | #162 | Good 12.7% |
| Palestinians | 63.1 /100 | #163 | Good 12.7% |
| Immigrants | Nigeria | 62.8 /100 | #164 | Good 12.7% |
| Immigrants | Cambodia | 62.2 /100 | #165 | Good 12.7% |
| Immigrants | Guyana | 60.5 /100 | #166 | Good 12.7% |
| Immigrants | Sudan | 58.2 /100 | #167 | Average 12.7% |
| Immigrants | Barbados | 57.7 /100 | #168 | Average 12.7% |
Demographics Similar to Immigrants from Sweden by Single Male Poverty
In terms of single male poverty, the demographic groups most similar to Immigrants from Sweden are Immigrants from Italy (12.2%, a difference of 0.050%), Guamanian/Chamorro (12.2%, a difference of 0.050%), Immigrants from Cuba (12.2%, a difference of 0.090%), Mongolian (12.2%, a difference of 0.15%), and Colombian (12.2%, a difference of 0.16%).
| Demographics | Rating | Rank | Single Male Poverty |
| Immigrants | Ireland | 98.3 /100 | #89 | Exceptional 12.1% |
| South American Indians | 98.3 /100 | #90 | Exceptional 12.1% |
| Immigrants | Turkey | 98.2 /100 | #91 | Exceptional 12.1% |
| Spanish American Indians | 98.0 /100 | #92 | Exceptional 12.1% |
| Immigrants | Bosnia and Herzegovina | 97.9 /100 | #93 | Exceptional 12.1% |
| Colombians | 97.8 /100 | #94 | Exceptional 12.2% |
| Mongolians | 97.7 /100 | #95 | Exceptional 12.2% |
| Immigrants | Sweden | 97.5 /100 | #96 | Exceptional 12.2% |
| Immigrants | Italy | 97.4 /100 | #97 | Exceptional 12.2% |
| Guamanians/Chamorros | 97.4 /100 | #98 | Exceptional 12.2% |
| Immigrants | Cuba | 97.3 /100 | #99 | Exceptional 12.2% |
| Immigrants | Australia | 97.1 /100 | #100 | Exceptional 12.2% |
| Immigrants | Latvia | 97.0 /100 | #101 | Exceptional 12.2% |
| Immigrants | Europe | 97.0 /100 | #102 | Exceptional 12.2% |
| Immigrants | Armenia | 96.7 /100 | #103 | Exceptional 12.2% |