Subsaharan African vs Immigrants from Sweden Single Male Poverty
COMPARE
Subsaharan African
Immigrants from Sweden
Single Male Poverty
Single Male Poverty Comparison
Sub-Saharan Africans
Immigrants from Sweden
13.7%
SINGLE MALE POVERTY
0.5/ 100
METRIC RATING
254th/ 347
METRIC RANK
12.2%
SINGLE MALE POVERTY
97.5/ 100
METRIC RATING
96th/ 347
METRIC RANK
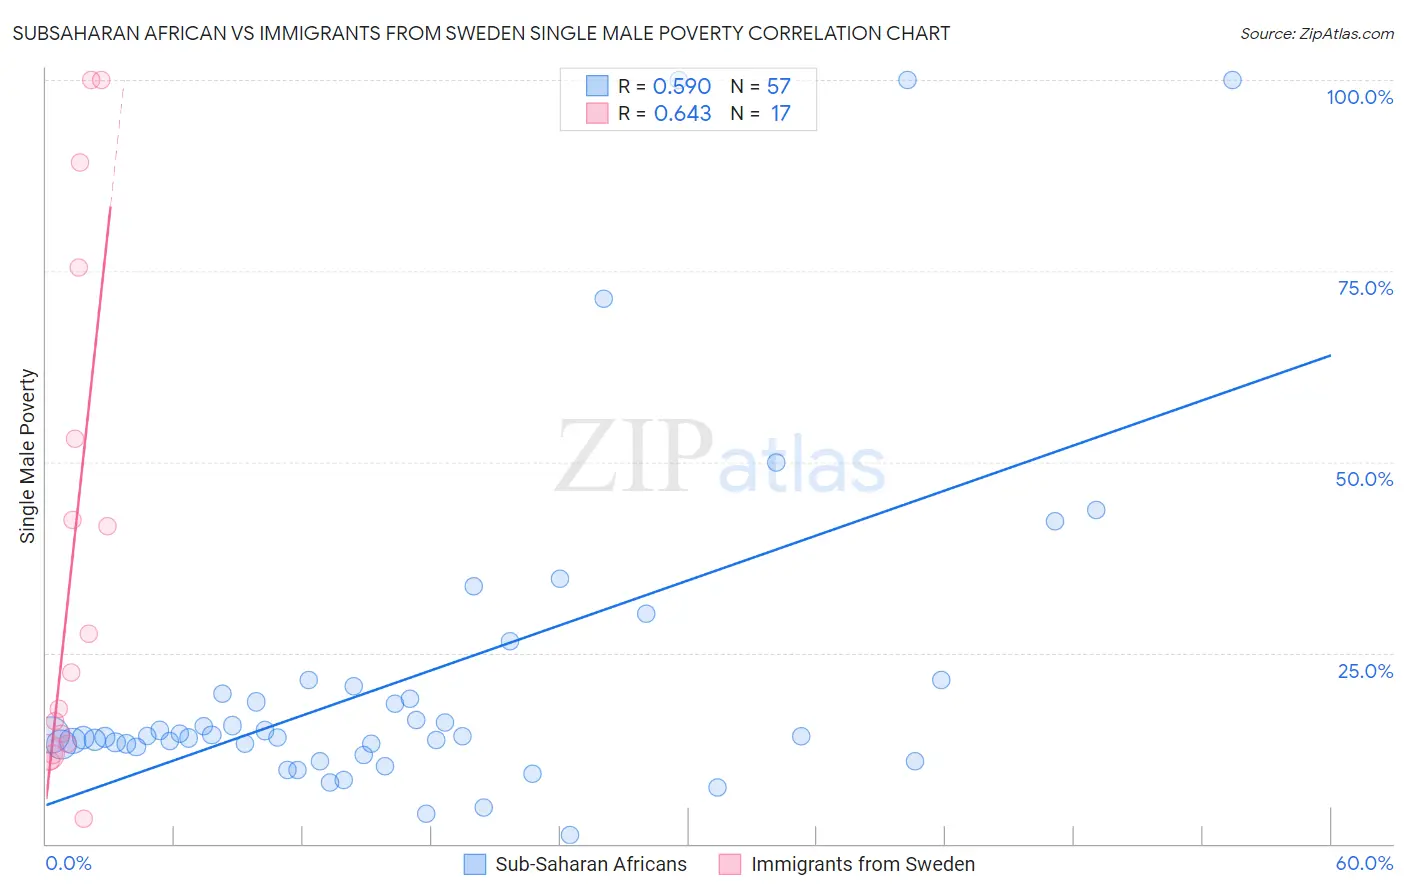
Subsaharan African vs Immigrants from Sweden Single Male Poverty Correlation Chart
The statistical analysis conducted on geographies consisting of 440,120,617 people shows a substantial positive correlation between the proportion of Sub-Saharan Africans and poverty level among single males in the United States with a correlation coefficient (R) of 0.590 and weighted average of 13.7%. Similarly, the statistical analysis conducted on geographies consisting of 151,415,814 people shows a significant positive correlation between the proportion of Immigrants from Sweden and poverty level among single males in the United States with a correlation coefficient (R) of 0.643 and weighted average of 12.2%, a difference of 12.4%.
Single Male Poverty Correlation Summary
| Measurement | Subsaharan African | Immigrants from Sweden |
| Minimum | 1.1% | 3.3% |
| Maximum | 100.0% | 100.0% |
| Range | 98.9% | 96.7% |
| Mean | 21.8% | 38.3% |
| Median | 14.1% | 22.4% |
| Interquartile 25% (IQ1) | 12.8% | 12.5% |
| Interquartile 75% (IQ3) | 20.1% | 64.3% |
| Interquartile Range (IQR) | 7.3% | 51.7% |
| Standard Deviation (Sample) | 22.0% | 33.3% |
| Standard Deviation (Population) | 21.8% | 32.3% |
Similar Demographics by Single Male Poverty
Demographics Similar to Sub-Saharan Africans by Single Male Poverty
In terms of single male poverty, the demographic groups most similar to Sub-Saharan Africans are Spaniard (13.7%, a difference of 0.11%), Immigrants from Belize (13.7%, a difference of 0.21%), Immigrants from Central America (13.8%, a difference of 0.40%), Immigrants from Guatemala (13.8%, a difference of 0.47%), and Guatemalan (13.8%, a difference of 0.51%).
| Demographics | Rating | Rank | Single Male Poverty |
| Belgians | 1.2 /100 | #247 | Tragic 13.5% |
| Czechs | 1.2 /100 | #248 | Tragic 13.5% |
| Spanish | 1.0 /100 | #249 | Tragic 13.6% |
| Immigrants | Somalia | 1.0 /100 | #250 | Tragic 13.6% |
| Immigrants | Zaire | 0.9 /100 | #251 | Tragic 13.6% |
| Finns | 0.9 /100 | #252 | Tragic 13.6% |
| German Russians | 0.8 /100 | #253 | Tragic 13.6% |
| Sub-Saharan Africans | 0.5 /100 | #254 | Tragic 13.7% |
| Spaniards | 0.4 /100 | #255 | Tragic 13.7% |
| Immigrants | Belize | 0.4 /100 | #256 | Tragic 13.7% |
| Immigrants | Central America | 0.3 /100 | #257 | Tragic 13.8% |
| Immigrants | Guatemala | 0.3 /100 | #258 | Tragic 13.8% |
| Guatemalans | 0.3 /100 | #259 | Tragic 13.8% |
| Swiss | 0.3 /100 | #260 | Tragic 13.8% |
| Hungarians | 0.3 /100 | #261 | Tragic 13.8% |
Demographics Similar to Immigrants from Sweden by Single Male Poverty
In terms of single male poverty, the demographic groups most similar to Immigrants from Sweden are Immigrants from Italy (12.2%, a difference of 0.050%), Guamanian/Chamorro (12.2%, a difference of 0.050%), Immigrants from Cuba (12.2%, a difference of 0.090%), Mongolian (12.2%, a difference of 0.15%), and Colombian (12.2%, a difference of 0.16%).
| Demographics | Rating | Rank | Single Male Poverty |
| Immigrants | Ireland | 98.3 /100 | #89 | Exceptional 12.1% |
| South American Indians | 98.3 /100 | #90 | Exceptional 12.1% |
| Immigrants | Turkey | 98.2 /100 | #91 | Exceptional 12.1% |
| Spanish American Indians | 98.0 /100 | #92 | Exceptional 12.1% |
| Immigrants | Bosnia and Herzegovina | 97.9 /100 | #93 | Exceptional 12.1% |
| Colombians | 97.8 /100 | #94 | Exceptional 12.2% |
| Mongolians | 97.7 /100 | #95 | Exceptional 12.2% |
| Immigrants | Sweden | 97.5 /100 | #96 | Exceptional 12.2% |
| Immigrants | Italy | 97.4 /100 | #97 | Exceptional 12.2% |
| Guamanians/Chamorros | 97.4 /100 | #98 | Exceptional 12.2% |
| Immigrants | Cuba | 97.3 /100 | #99 | Exceptional 12.2% |
| Immigrants | Australia | 97.1 /100 | #100 | Exceptional 12.2% |
| Immigrants | Latvia | 97.0 /100 | #101 | Exceptional 12.2% |
| Immigrants | Europe | 97.0 /100 | #102 | Exceptional 12.2% |
| Immigrants | Armenia | 96.7 /100 | #103 | Exceptional 12.2% |