Tongan vs Immigrants from Bahamas Householder Income Under 25 years
COMPARE
Tongan
Immigrants from Bahamas
Householder Income Under 25 years
Householder Income Under 25 years Comparison
Tongans
Immigrants from Bahamas
$56,972
HOUSEHOLDER INCOME UNDER 25 YEARS
100.0/ 100
METRIC RATING
23rd/ 347
METRIC RANK
$45,793
HOUSEHOLDER INCOME UNDER 25 YEARS
0.0/ 100
METRIC RATING
325th/ 347
METRIC RANK
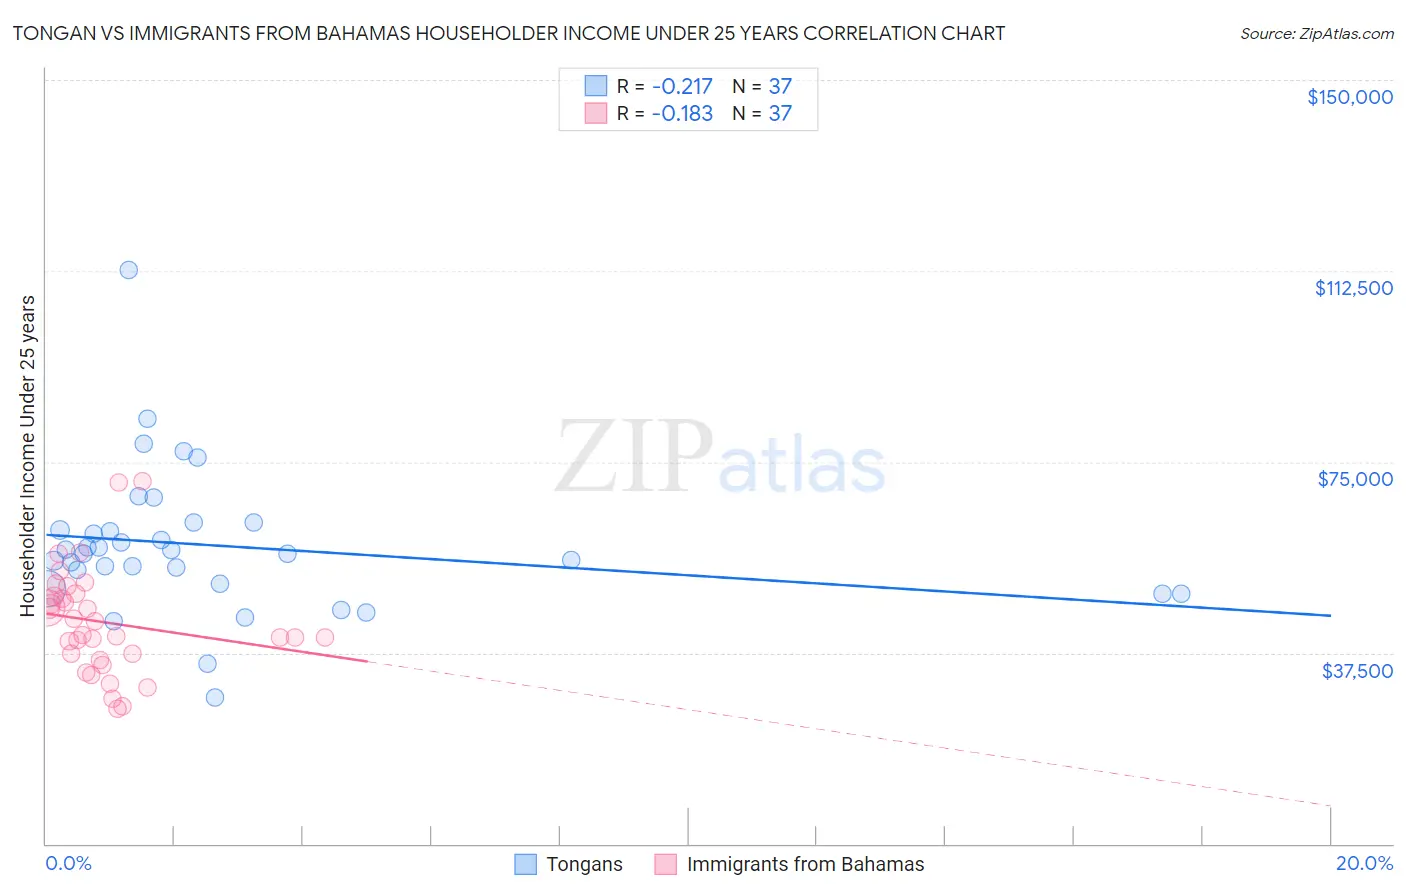
Tongan vs Immigrants from Bahamas Householder Income Under 25 years Correlation Chart
The statistical analysis conducted on geographies consisting of 96,005,188 people shows a weak negative correlation between the proportion of Tongans and household income with householder under the age of 25 in the United States with a correlation coefficient (R) of -0.217 and weighted average of $56,972. Similarly, the statistical analysis conducted on geographies consisting of 97,494,664 people shows a poor negative correlation between the proportion of Immigrants from Bahamas and household income with householder under the age of 25 in the United States with a correlation coefficient (R) of -0.183 and weighted average of $45,793, a difference of 24.4%.
Householder Income Under 25 years Correlation Summary
| Measurement | Tongan | Immigrants from Bahamas |
| Minimum | $28,696 | $26,418 |
| Maximum | $112,736 | $71,250 |
| Range | $84,040 | $44,832 |
| Mean | $58,510 | $43,510 |
| Median | $56,941 | $41,087 |
| Interquartile 25% (IQ1) | $50,618 | $36,692 |
| Interquartile 75% (IQ3) | $62,342 | $48,889 |
| Interquartile Range (IQR) | $11,724 | $12,196 |
| Standard Deviation (Sample) | $14,382 | $10,378 |
| Standard Deviation (Population) | $14,186 | $10,237 |
Similar Demographics by Householder Income Under 25 years
Demographics Similar to Tongans by Householder Income Under 25 years
In terms of householder income under 25 years, the demographic groups most similar to Tongans are Asian ($57,003, a difference of 0.050%), Bhutanese ($57,078, a difference of 0.18%), Immigrants from Ireland ($57,075, a difference of 0.18%), Immigrants from Fiji ($57,074, a difference of 0.18%), and Immigrants from Singapore ($56,835, a difference of 0.24%).
| Demographics | Rating | Rank | Householder Income Under 25 years |
| Immigrants | Afghanistan | 100.0 /100 | #16 | Exceptional $57,478 |
| Sierra Leoneans | 100.0 /100 | #17 | Exceptional $57,272 |
| Immigrants | Eastern Asia | 100.0 /100 | #18 | Exceptional $57,123 |
| Bhutanese | 100.0 /100 | #19 | Exceptional $57,078 |
| Immigrants | Ireland | 100.0 /100 | #20 | Exceptional $57,075 |
| Immigrants | Fiji | 100.0 /100 | #21 | Exceptional $57,074 |
| Asians | 100.0 /100 | #22 | Exceptional $57,003 |
| Tongans | 100.0 /100 | #23 | Exceptional $56,972 |
| Immigrants | Singapore | 100.0 /100 | #24 | Exceptional $56,835 |
| Immigrants | Pakistan | 100.0 /100 | #25 | Exceptional $56,789 |
| Immigrants | Australia | 100.0 /100 | #26 | Exceptional $56,660 |
| Immigrants | North Macedonia | 100.0 /100 | #27 | Exceptional $56,503 |
| Immigrants | Peru | 100.0 /100 | #28 | Exceptional $56,384 |
| Immigrants | Asia | 100.0 /100 | #29 | Exceptional $56,379 |
| Immigrants | Moldova | 100.0 /100 | #30 | Exceptional $56,168 |
Demographics Similar to Immigrants from Bahamas by Householder Income Under 25 years
In terms of householder income under 25 years, the demographic groups most similar to Immigrants from Bahamas are Dutch West Indian ($45,816, a difference of 0.050%), Osage ($45,764, a difference of 0.060%), Bahamian ($45,743, a difference of 0.11%), German Russian ($45,673, a difference of 0.26%), and Seminole ($45,649, a difference of 0.32%).
| Demographics | Rating | Rank | Householder Income Under 25 years |
| Spanish Americans | 0.0 /100 | #318 | Tragic $46,913 |
| Africans | 0.0 /100 | #319 | Tragic $46,838 |
| Immigrants | Sudan | 0.0 /100 | #320 | Tragic $46,791 |
| Potawatomi | 0.0 /100 | #321 | Tragic $46,462 |
| Sioux | 0.0 /100 | #322 | Tragic $46,417 |
| Immigrants | Saudi Arabia | 0.0 /100 | #323 | Tragic $46,187 |
| Dutch West Indians | 0.0 /100 | #324 | Tragic $45,816 |
| Immigrants | Bahamas | 0.0 /100 | #325 | Tragic $45,793 |
| Osage | 0.0 /100 | #326 | Tragic $45,764 |
| Bahamians | 0.0 /100 | #327 | Tragic $45,743 |
| German Russians | 0.0 /100 | #328 | Tragic $45,673 |
| Seminole | 0.0 /100 | #329 | Tragic $45,649 |
| Indonesians | 0.0 /100 | #330 | Tragic $45,566 |
| Immigrants | Zaire | 0.0 /100 | #331 | Tragic $45,529 |
| Choctaw | 0.0 /100 | #332 | Tragic $45,450 |