Tongan vs Ute Single Mother Poverty
COMPARE
Tongan
Ute
Single Mother Poverty
Single Mother Poverty Comparison
Tongans
Ute
26.5%
SINGLE MOTHER POVERTY
99.9/ 100
METRIC RATING
32nd/ 347
METRIC RANK
35.7%
SINGLE MOTHER POVERTY
0.0/ 100
METRIC RATING
325th/ 347
METRIC RANK
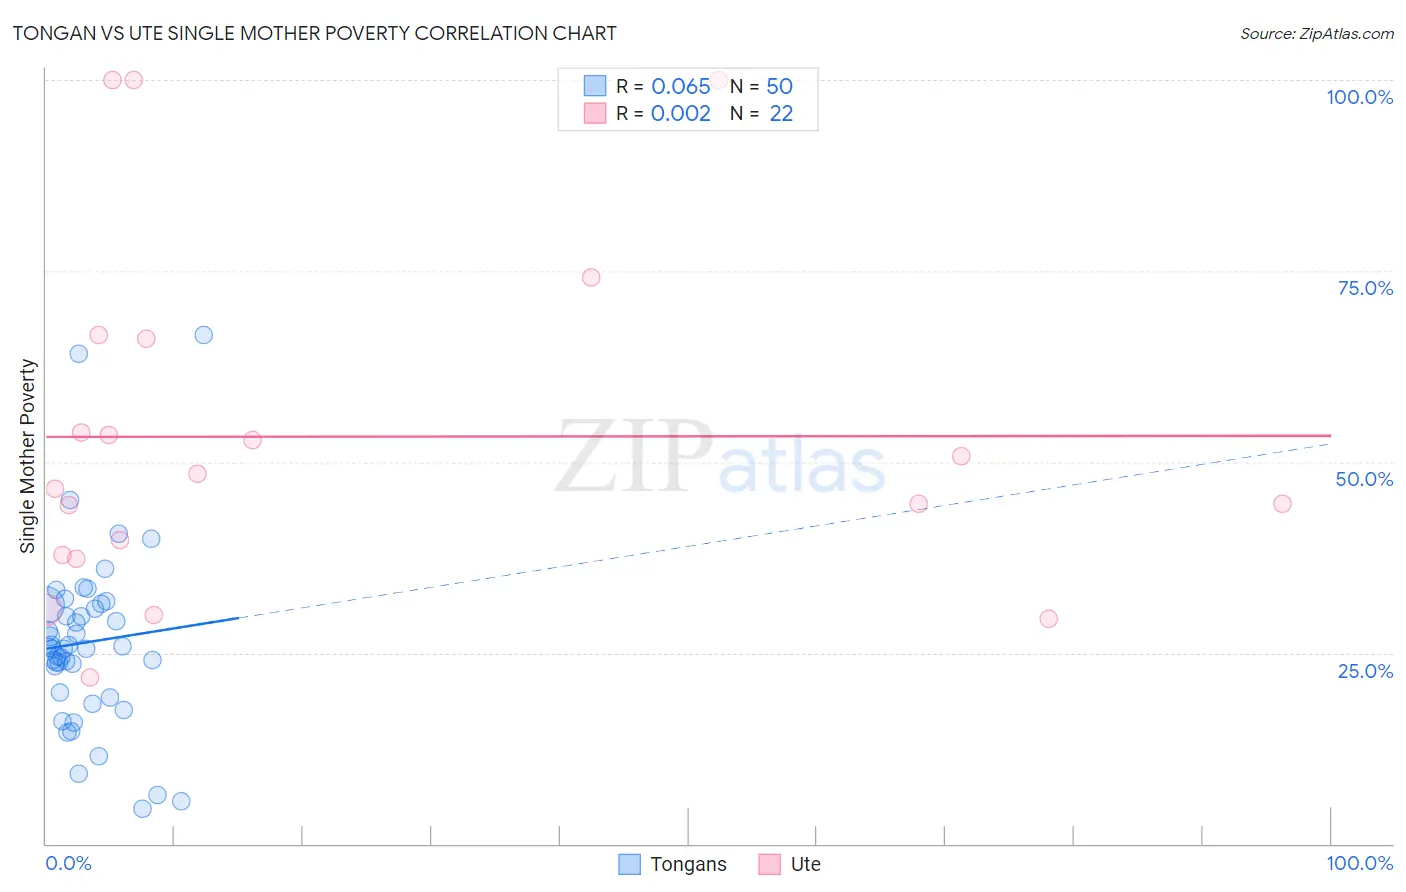
Tongan vs Ute Single Mother Poverty Correlation Chart
The statistical analysis conducted on geographies consisting of 102,184,509 people shows a slight positive correlation between the proportion of Tongans and poverty level among single mothers in the United States with a correlation coefficient (R) of 0.065 and weighted average of 26.5%. Similarly, the statistical analysis conducted on geographies consisting of 55,474,720 people shows no correlation between the proportion of Ute and poverty level among single mothers in the United States with a correlation coefficient (R) of 0.002 and weighted average of 35.7%, a difference of 34.5%.
Single Mother Poverty Correlation Summary
| Measurement | Tongan | Ute |
| Minimum | 4.6% | 21.7% |
| Maximum | 66.7% | 100.0% |
| Range | 62.1% | 78.3% |
| Mean | 26.4% | 53.3% |
| Median | 25.6% | 47.4% |
| Interquartile 25% (IQ1) | 19.8% | 37.9% |
| Interquartile 75% (IQ3) | 31.3% | 66.2% |
| Interquartile Range (IQR) | 11.5% | 28.3% |
| Standard Deviation (Sample) | 11.8% | 22.8% |
| Standard Deviation (Population) | 11.7% | 22.3% |
Similar Demographics by Single Mother Poverty
Demographics Similar to Tongans by Single Mother Poverty
In terms of single mother poverty, the demographic groups most similar to Tongans are Bulgarian (26.5%, a difference of 0.040%), Immigrants from Indonesia (26.6%, a difference of 0.050%), Maltese (26.6%, a difference of 0.17%), Okinawan (26.6%, a difference of 0.21%), and Immigrants from Israel (26.6%, a difference of 0.22%).
| Demographics | Rating | Rank | Single Mother Poverty |
| Immigrants | Asia | 100.0 /100 | #25 | Exceptional 26.3% |
| Immigrants | Sri Lanka | 100.0 /100 | #26 | Exceptional 26.3% |
| Immigrants | Japan | 100.0 /100 | #27 | Exceptional 26.4% |
| Koreans | 100.0 /100 | #28 | Exceptional 26.4% |
| Jordanians | 100.0 /100 | #29 | Exceptional 26.4% |
| Turks | 100.0 /100 | #30 | Exceptional 26.4% |
| Immigrants | Philippines | 100.0 /100 | #31 | Exceptional 26.5% |
| Tongans | 99.9 /100 | #32 | Exceptional 26.5% |
| Bulgarians | 99.9 /100 | #33 | Exceptional 26.5% |
| Immigrants | Indonesia | 99.9 /100 | #34 | Exceptional 26.6% |
| Maltese | 99.9 /100 | #35 | Exceptional 26.6% |
| Okinawans | 99.9 /100 | #36 | Exceptional 26.6% |
| Immigrants | Israel | 99.9 /100 | #37 | Exceptional 26.6% |
| Immigrants | Fiji | 99.9 /100 | #38 | Exceptional 26.6% |
| Sri Lankans | 99.9 /100 | #39 | Exceptional 26.7% |
Demographics Similar to Ute by Single Mother Poverty
In terms of single mother poverty, the demographic groups most similar to Ute are Seminole (35.8%, a difference of 0.30%), Ottawa (35.5%, a difference of 0.48%), Kiowa (35.5%, a difference of 0.69%), Black/African American (35.2%, a difference of 1.4%), and Paiute (35.1%, a difference of 1.6%).
| Demographics | Rating | Rank | Single Mother Poverty |
| Immigrants | Honduras | 0.0 /100 | #318 | Tragic 34.7% |
| Chippewa | 0.0 /100 | #319 | Tragic 34.8% |
| Iroquois | 0.0 /100 | #320 | Tragic 34.8% |
| Paiute | 0.0 /100 | #321 | Tragic 35.1% |
| Blacks/African Americans | 0.0 /100 | #322 | Tragic 35.2% |
| Kiowa | 0.0 /100 | #323 | Tragic 35.5% |
| Ottawa | 0.0 /100 | #324 | Tragic 35.5% |
| Ute | 0.0 /100 | #325 | Tragic 35.7% |
| Seminole | 0.0 /100 | #326 | Tragic 35.8% |
| Yakama | 0.0 /100 | #327 | Tragic 36.4% |
| Choctaw | 0.0 /100 | #328 | Tragic 36.4% |
| Apache | 0.0 /100 | #329 | Tragic 36.6% |
| Natives/Alaskans | 0.0 /100 | #330 | Tragic 36.6% |
| Creek | 0.0 /100 | #331 | Tragic 36.7% |
| Dutch West Indians | 0.0 /100 | #332 | Tragic 36.8% |