Tohono O'odham vs Immigrants from Uzbekistan Female Poverty Among 25-34 Year Olds
COMPARE
Tohono O'odham
Immigrants from Uzbekistan
Female Poverty Among 25-34 Year Olds
Female Poverty Among 25-34 Year Olds Comparison
Tohono O'odham
Immigrants from Uzbekistan
24.7%
FEMALE POVERTY AMONG 25-34 YEAR OLDS
0.0/ 100
METRIC RATING
344th/ 347
METRIC RANK
12.9%
FEMALE POVERTY AMONG 25-34 YEAR OLDS
89.6/ 100
METRIC RATING
130th/ 347
METRIC RANK
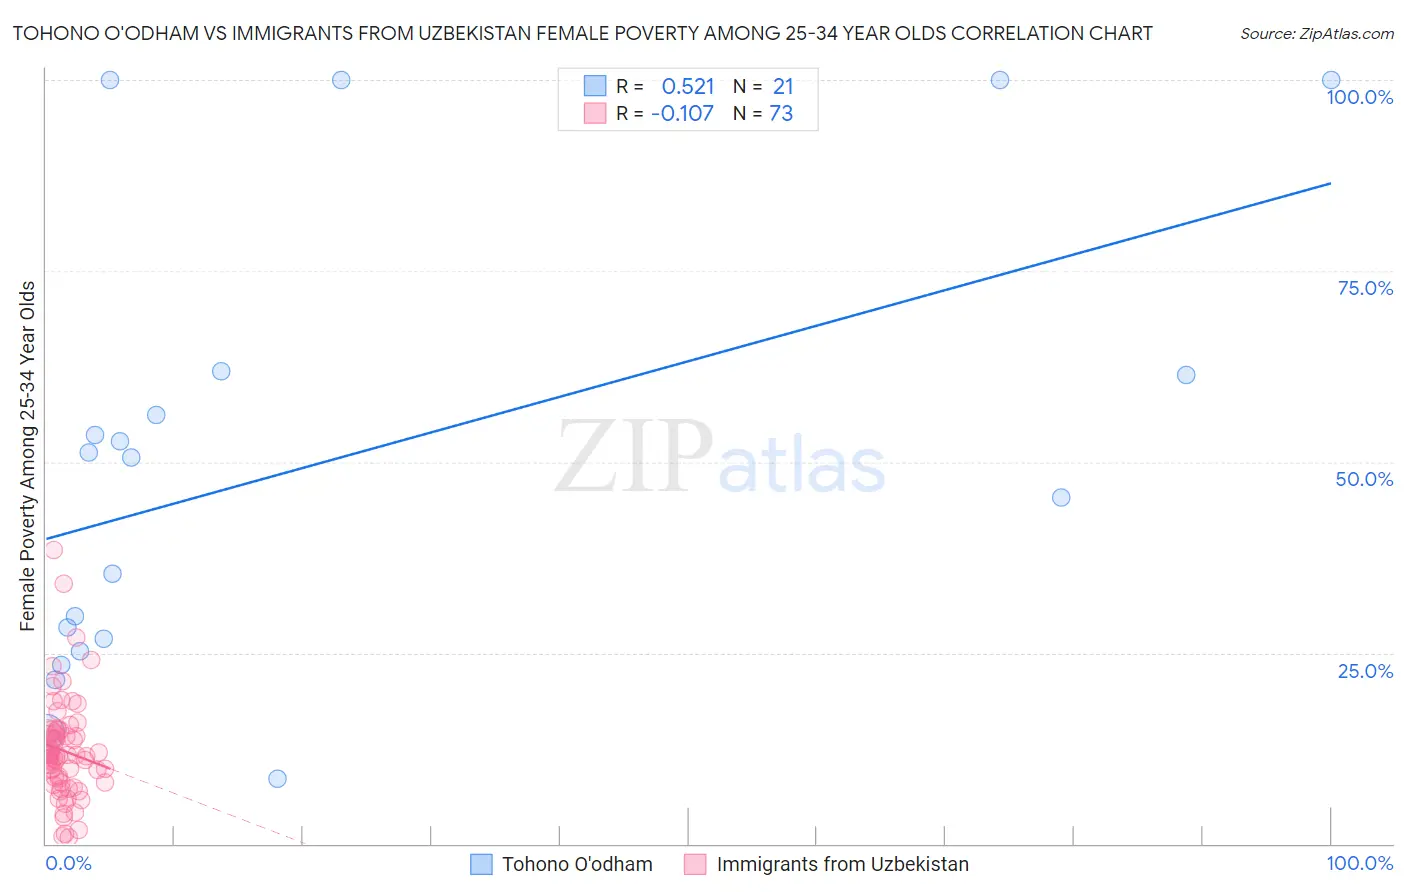
Tohono O'odham vs Immigrants from Uzbekistan Female Poverty Among 25-34 Year Olds Correlation Chart
The statistical analysis conducted on geographies consisting of 58,640,962 people shows a substantial positive correlation between the proportion of Tohono O'odham and poverty level among females between the ages 25 and 34 in the United States with a correlation coefficient (R) of 0.521 and weighted average of 24.7%. Similarly, the statistical analysis conducted on geographies consisting of 118,064,863 people shows a poor negative correlation between the proportion of Immigrants from Uzbekistan and poverty level among females between the ages 25 and 34 in the United States with a correlation coefficient (R) of -0.107 and weighted average of 12.9%, a difference of 91.4%.
Female Poverty Among 25-34 Year Olds Correlation Summary
| Measurement | Tohono O'odham | Immigrants from Uzbekistan |
| Minimum | 8.6% | 0.84% |
| Maximum | 100.0% | 38.4% |
| Range | 91.4% | 37.6% |
| Mean | 49.8% | 12.2% |
| Median | 50.6% | 11.5% |
| Interquartile 25% (IQ1) | 26.0% | 8.0% |
| Interquartile 75% (IQ3) | 61.6% | 14.6% |
| Interquartile Range (IQR) | 35.6% | 6.6% |
| Standard Deviation (Sample) | 29.2% | 6.7% |
| Standard Deviation (Population) | 28.5% | 6.6% |
Similar Demographics by Female Poverty Among 25-34 Year Olds
Demographics Similar to Tohono O'odham by Female Poverty Among 25-34 Year Olds
In terms of female poverty among 25-34 year olds, the demographic groups most similar to Tohono O'odham are Yup'ik (24.3%, a difference of 1.8%), Pima (25.3%, a difference of 2.2%), Hopi (23.7%, a difference of 4.5%), Navajo (23.3%, a difference of 6.0%), and Lumbee (26.3%, a difference of 6.2%).
| Demographics | Rating | Rank | Female Poverty Among 25-34 Year Olds |
| Cajuns | 0.0 /100 | #333 | Tragic 19.9% |
| Apache | 0.0 /100 | #334 | Tragic 20.1% |
| Natives/Alaskans | 0.0 /100 | #335 | Tragic 20.3% |
| Pueblo | 0.0 /100 | #336 | Tragic 22.2% |
| Crow | 0.0 /100 | #337 | Tragic 22.7% |
| Houma | 0.0 /100 | #338 | Tragic 22.7% |
| Yuman | 0.0 /100 | #339 | Tragic 22.9% |
| Sioux | 0.0 /100 | #340 | Tragic 23.0% |
| Navajo | 0.0 /100 | #341 | Tragic 23.3% |
| Hopi | 0.0 /100 | #342 | Tragic 23.7% |
| Yup'ik | 0.0 /100 | #343 | Tragic 24.3% |
| Tohono O'odham | 0.0 /100 | #344 | Tragic 24.7% |
| Pima | 0.0 /100 | #345 | Tragic 25.3% |
| Lumbee | 0.0 /100 | #346 | Tragic 26.3% |
| Puerto Ricans | 0.0 /100 | #347 | Tragic 26.3% |
Demographics Similar to Immigrants from Uzbekistan by Female Poverty Among 25-34 Year Olds
In terms of female poverty among 25-34 year olds, the demographic groups most similar to Immigrants from Uzbekistan are Immigrants from North America (12.9%, a difference of 0.030%), Syrian (12.9%, a difference of 0.14%), Czech (12.9%, a difference of 0.16%), Pakistani (13.0%, a difference of 0.27%), and Immigrants from Hungary (13.0%, a difference of 0.29%).
| Demographics | Rating | Rank | Female Poverty Among 25-34 Year Olds |
| Slovenes | 92.7 /100 | #123 | Exceptional 12.8% |
| Immigrants | Netherlands | 92.0 /100 | #124 | Exceptional 12.8% |
| Immigrants | Canada | 91.5 /100 | #125 | Exceptional 12.9% |
| Immigrants | Fiji | 91.2 /100 | #126 | Exceptional 12.9% |
| Czechs | 90.3 /100 | #127 | Exceptional 12.9% |
| Syrians | 90.2 /100 | #128 | Exceptional 12.9% |
| Immigrants | North America | 89.7 /100 | #129 | Excellent 12.9% |
| Immigrants | Uzbekistan | 89.6 /100 | #130 | Excellent 12.9% |
| Pakistanis | 88.4 /100 | #131 | Excellent 13.0% |
| Immigrants | Hungary | 88.3 /100 | #132 | Excellent 13.0% |
| Serbians | 87.6 /100 | #133 | Excellent 13.0% |
| Afghans | 85.8 /100 | #134 | Excellent 13.0% |
| South Africans | 85.7 /100 | #135 | Excellent 13.0% |
| Immigrants | England | 85.5 /100 | #136 | Excellent 13.0% |
| Immigrants | Chile | 84.6 /100 | #137 | Excellent 13.1% |