Chickasaw vs Immigrants from Uzbekistan Female Poverty Among 25-34 Year Olds
COMPARE
Chickasaw
Immigrants from Uzbekistan
Female Poverty Among 25-34 Year Olds
Female Poverty Among 25-34 Year Olds Comparison
Chickasaw
Immigrants from Uzbekistan
17.0%
FEMALE POVERTY AMONG 25-34 YEAR OLDS
0.0/ 100
METRIC RATING
306th/ 347
METRIC RANK
12.9%
FEMALE POVERTY AMONG 25-34 YEAR OLDS
89.6/ 100
METRIC RATING
130th/ 347
METRIC RANK
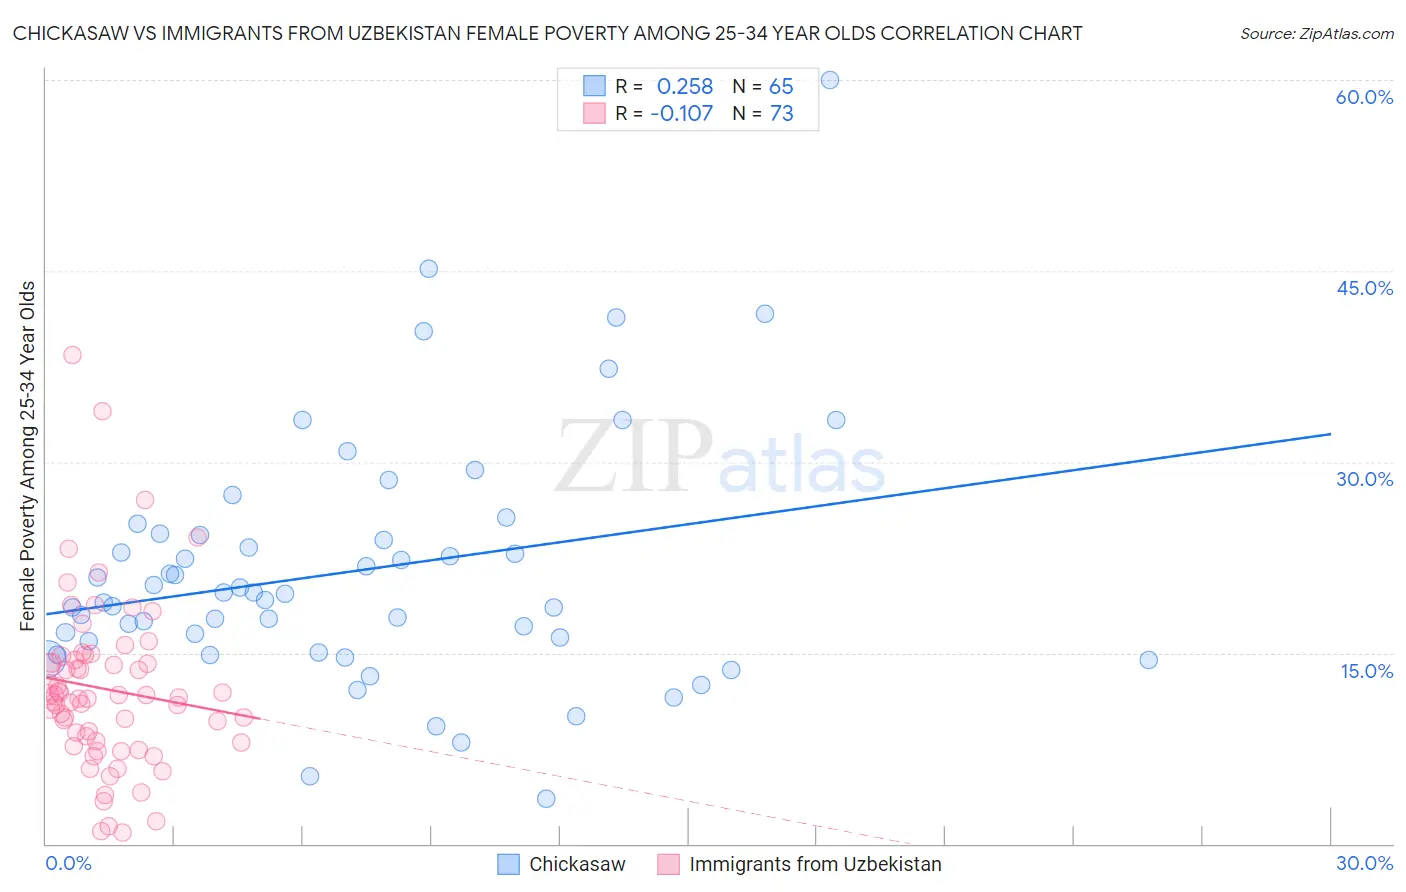
Chickasaw vs Immigrants from Uzbekistan Female Poverty Among 25-34 Year Olds Correlation Chart
The statistical analysis conducted on geographies consisting of 147,041,279 people shows a weak positive correlation between the proportion of Chickasaw and poverty level among females between the ages 25 and 34 in the United States with a correlation coefficient (R) of 0.258 and weighted average of 17.0%. Similarly, the statistical analysis conducted on geographies consisting of 118,064,863 people shows a poor negative correlation between the proportion of Immigrants from Uzbekistan and poverty level among females between the ages 25 and 34 in the United States with a correlation coefficient (R) of -0.107 and weighted average of 12.9%, a difference of 31.6%.
Female Poverty Among 25-34 Year Olds Correlation Summary
| Measurement | Chickasaw | Immigrants from Uzbekistan |
| Minimum | 3.5% | 0.84% |
| Maximum | 60.0% | 38.4% |
| Range | 56.5% | 37.6% |
| Mean | 21.5% | 12.2% |
| Median | 19.7% | 11.5% |
| Interquartile 25% (IQ1) | 15.5% | 8.0% |
| Interquartile 75% (IQ3) | 24.3% | 14.6% |
| Interquartile Range (IQR) | 8.8% | 6.6% |
| Standard Deviation (Sample) | 9.8% | 6.7% |
| Standard Deviation (Population) | 9.7% | 6.6% |
Similar Demographics by Female Poverty Among 25-34 Year Olds
Demographics Similar to Chickasaw by Female Poverty Among 25-34 Year Olds
In terms of female poverty among 25-34 year olds, the demographic groups most similar to Chickasaw are Yaqui (17.0%, a difference of 0.020%), African (17.0%, a difference of 0.22%), Ottawa (17.1%, a difference of 0.52%), Immigrants from Cabo Verde (16.9%, a difference of 0.58%), and Honduran (16.9%, a difference of 0.75%).
| Demographics | Rating | Rank | Female Poverty Among 25-34 Year Olds |
| Spanish Americans | 0.0 /100 | #299 | Tragic 16.7% |
| U.S. Virgin Islanders | 0.0 /100 | #300 | Tragic 16.7% |
| Immigrants | Congo | 0.0 /100 | #301 | Tragic 16.7% |
| Alaska Natives | 0.0 /100 | #302 | Tragic 16.8% |
| Immigrants | Mexico | 0.0 /100 | #303 | Tragic 16.8% |
| Hondurans | 0.0 /100 | #304 | Tragic 16.9% |
| Immigrants | Cabo Verde | 0.0 /100 | #305 | Tragic 16.9% |
| Chickasaw | 0.0 /100 | #306 | Tragic 17.0% |
| Yaqui | 0.0 /100 | #307 | Tragic 17.0% |
| Africans | 0.0 /100 | #308 | Tragic 17.0% |
| Ottawa | 0.0 /100 | #309 | Tragic 17.1% |
| Cherokee | 0.0 /100 | #310 | Tragic 17.2% |
| Immigrants | Honduras | 0.0 /100 | #311 | Tragic 17.3% |
| Iroquois | 0.0 /100 | #312 | Tragic 17.5% |
| Colville | 0.0 /100 | #313 | Tragic 17.5% |
Demographics Similar to Immigrants from Uzbekistan by Female Poverty Among 25-34 Year Olds
In terms of female poverty among 25-34 year olds, the demographic groups most similar to Immigrants from Uzbekistan are Immigrants from North America (12.9%, a difference of 0.030%), Syrian (12.9%, a difference of 0.14%), Czech (12.9%, a difference of 0.16%), Pakistani (13.0%, a difference of 0.27%), and Immigrants from Hungary (13.0%, a difference of 0.29%).
| Demographics | Rating | Rank | Female Poverty Among 25-34 Year Olds |
| Slovenes | 92.7 /100 | #123 | Exceptional 12.8% |
| Immigrants | Netherlands | 92.0 /100 | #124 | Exceptional 12.8% |
| Immigrants | Canada | 91.5 /100 | #125 | Exceptional 12.9% |
| Immigrants | Fiji | 91.2 /100 | #126 | Exceptional 12.9% |
| Czechs | 90.3 /100 | #127 | Exceptional 12.9% |
| Syrians | 90.2 /100 | #128 | Exceptional 12.9% |
| Immigrants | North America | 89.7 /100 | #129 | Excellent 12.9% |
| Immigrants | Uzbekistan | 89.6 /100 | #130 | Excellent 12.9% |
| Pakistanis | 88.4 /100 | #131 | Excellent 13.0% |
| Immigrants | Hungary | 88.3 /100 | #132 | Excellent 13.0% |
| Serbians | 87.6 /100 | #133 | Excellent 13.0% |
| Afghans | 85.8 /100 | #134 | Excellent 13.0% |
| South Africans | 85.7 /100 | #135 | Excellent 13.0% |
| Immigrants | England | 85.5 /100 | #136 | Excellent 13.0% |
| Immigrants | Chile | 84.6 /100 | #137 | Excellent 13.1% |