Tohono O'odham vs Ethiopian Female Poverty Among 25-34 Year Olds
COMPARE
Tohono O'odham
Ethiopian
Female Poverty Among 25-34 Year Olds
Female Poverty Among 25-34 Year Olds Comparison
Tohono O'odham
Ethiopians
24.7%
FEMALE POVERTY AMONG 25-34 YEAR OLDS
0.0/ 100
METRIC RATING
344th/ 347
METRIC RANK
12.4%
FEMALE POVERTY AMONG 25-34 YEAR OLDS
98.0/ 100
METRIC RATING
82nd/ 347
METRIC RANK
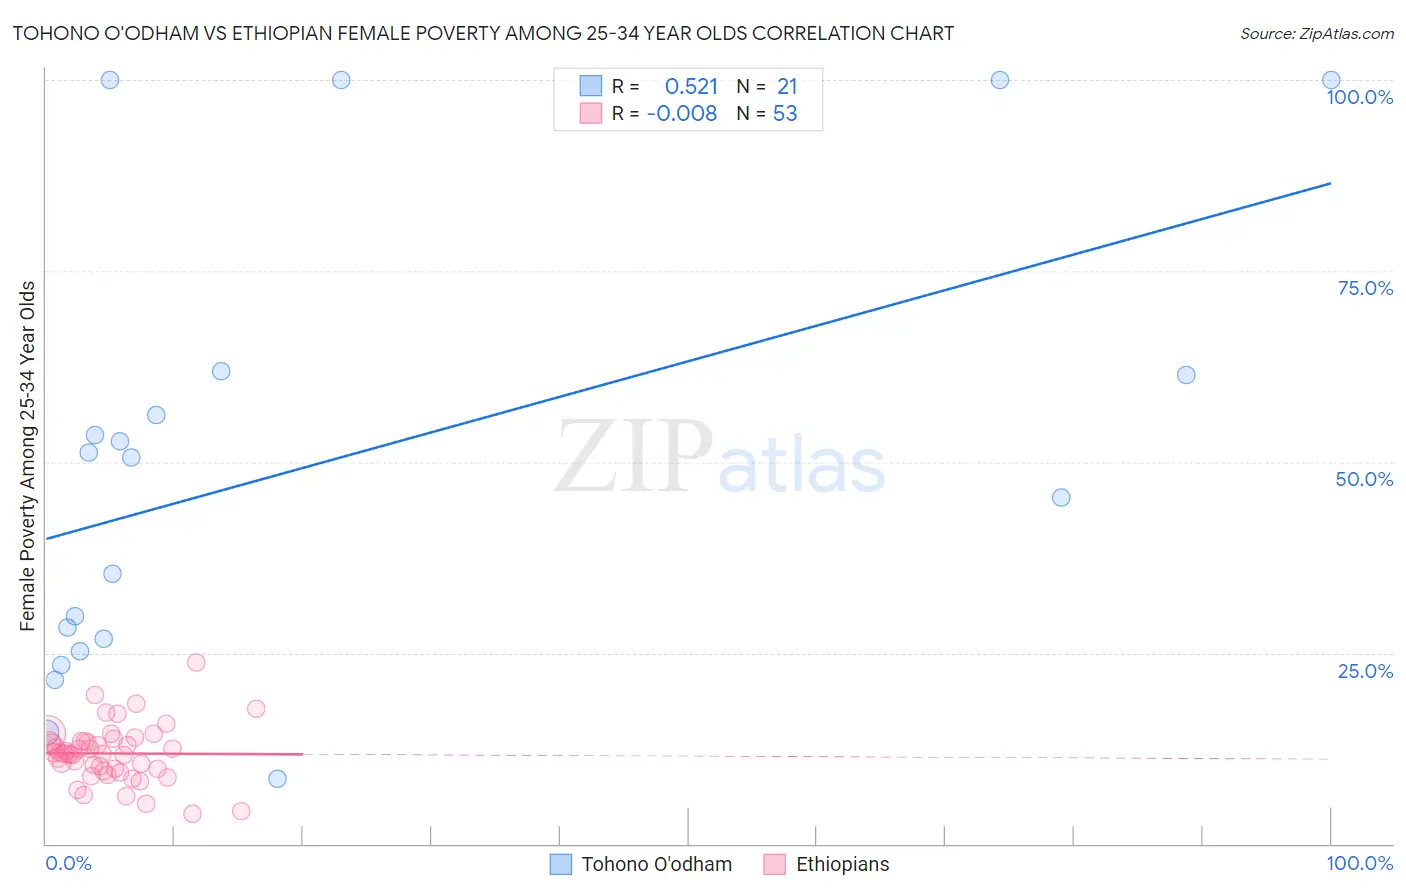
Tohono O'odham vs Ethiopian Female Poverty Among 25-34 Year Olds Correlation Chart
The statistical analysis conducted on geographies consisting of 58,640,962 people shows a substantial positive correlation between the proportion of Tohono O'odham and poverty level among females between the ages 25 and 34 in the United States with a correlation coefficient (R) of 0.521 and weighted average of 24.7%. Similarly, the statistical analysis conducted on geographies consisting of 221,750,930 people shows no correlation between the proportion of Ethiopians and poverty level among females between the ages 25 and 34 in the United States with a correlation coefficient (R) of -0.008 and weighted average of 12.4%, a difference of 99.0%.
Female Poverty Among 25-34 Year Olds Correlation Summary
| Measurement | Tohono O'odham | Ethiopian |
| Minimum | 8.6% | 4.0% |
| Maximum | 100.0% | 23.7% |
| Range | 91.4% | 19.7% |
| Mean | 49.8% | 11.8% |
| Median | 50.6% | 11.9% |
| Interquartile 25% (IQ1) | 26.0% | 9.7% |
| Interquartile 75% (IQ3) | 61.6% | 13.4% |
| Interquartile Range (IQR) | 35.6% | 3.7% |
| Standard Deviation (Sample) | 29.2% | 3.7% |
| Standard Deviation (Population) | 28.5% | 3.7% |
Similar Demographics by Female Poverty Among 25-34 Year Olds
Demographics Similar to Tohono O'odham by Female Poverty Among 25-34 Year Olds
In terms of female poverty among 25-34 year olds, the demographic groups most similar to Tohono O'odham are Yup'ik (24.3%, a difference of 1.8%), Pima (25.3%, a difference of 2.2%), Hopi (23.7%, a difference of 4.5%), Navajo (23.3%, a difference of 6.0%), and Lumbee (26.3%, a difference of 6.2%).
| Demographics | Rating | Rank | Female Poverty Among 25-34 Year Olds |
| Cajuns | 0.0 /100 | #333 | Tragic 19.9% |
| Apache | 0.0 /100 | #334 | Tragic 20.1% |
| Natives/Alaskans | 0.0 /100 | #335 | Tragic 20.3% |
| Pueblo | 0.0 /100 | #336 | Tragic 22.2% |
| Crow | 0.0 /100 | #337 | Tragic 22.7% |
| Houma | 0.0 /100 | #338 | Tragic 22.7% |
| Yuman | 0.0 /100 | #339 | Tragic 22.9% |
| Sioux | 0.0 /100 | #340 | Tragic 23.0% |
| Navajo | 0.0 /100 | #341 | Tragic 23.3% |
| Hopi | 0.0 /100 | #342 | Tragic 23.7% |
| Yup'ik | 0.0 /100 | #343 | Tragic 24.3% |
| Tohono O'odham | 0.0 /100 | #344 | Tragic 24.7% |
| Pima | 0.0 /100 | #345 | Tragic 25.3% |
| Lumbee | 0.0 /100 | #346 | Tragic 26.3% |
| Puerto Ricans | 0.0 /100 | #347 | Tragic 26.3% |
Demographics Similar to Ethiopians by Female Poverty Among 25-34 Year Olds
In terms of female poverty among 25-34 year olds, the demographic groups most similar to Ethiopians are Immigrants from Kazakhstan (12.4%, a difference of 0.080%), Immigrants from Malaysia (12.4%, a difference of 0.32%), Albanian (12.5%, a difference of 0.32%), Immigrants from Latvia (12.5%, a difference of 0.38%), and Immigrants from South Eastern Asia (12.5%, a difference of 0.49%).
| Demographics | Rating | Rank | Female Poverty Among 25-34 Year Olds |
| Estonians | 98.9 /100 | #75 | Exceptional 12.3% |
| Greeks | 98.9 /100 | #76 | Exceptional 12.3% |
| Immigrants | Italy | 98.8 /100 | #77 | Exceptional 12.3% |
| Immigrants | Ukraine | 98.6 /100 | #78 | Exceptional 12.3% |
| Immigrants | Jordan | 98.5 /100 | #79 | Exceptional 12.4% |
| Immigrants | Malaysia | 98.3 /100 | #80 | Exceptional 12.4% |
| Immigrants | Kazakhstan | 98.1 /100 | #81 | Exceptional 12.4% |
| Ethiopians | 98.0 /100 | #82 | Exceptional 12.4% |
| Albanians | 97.7 /100 | #83 | Exceptional 12.5% |
| Immigrants | Latvia | 97.7 /100 | #84 | Exceptional 12.5% |
| Immigrants | South Eastern Asia | 97.6 /100 | #85 | Exceptional 12.5% |
| Croatians | 97.5 /100 | #86 | Exceptional 12.5% |
| Argentineans | 97.5 /100 | #87 | Exceptional 12.5% |
| Immigrants | Austria | 97.4 /100 | #88 | Exceptional 12.5% |
| Italians | 97.2 /100 | #89 | Exceptional 12.5% |