Tohono O'odham vs Immigrants from Haiti Female Poverty Among 25-34 Year Olds
COMPARE
Tohono O'odham
Immigrants from Haiti
Female Poverty Among 25-34 Year Olds
Female Poverty Among 25-34 Year Olds Comparison
Tohono O'odham
Immigrants from Haiti
24.7%
FEMALE POVERTY AMONG 25-34 YEAR OLDS
0.0/ 100
METRIC RATING
344th/ 347
METRIC RANK
15.0%
FEMALE POVERTY AMONG 25-34 YEAR OLDS
0.5/ 100
METRIC RATING
249th/ 347
METRIC RANK
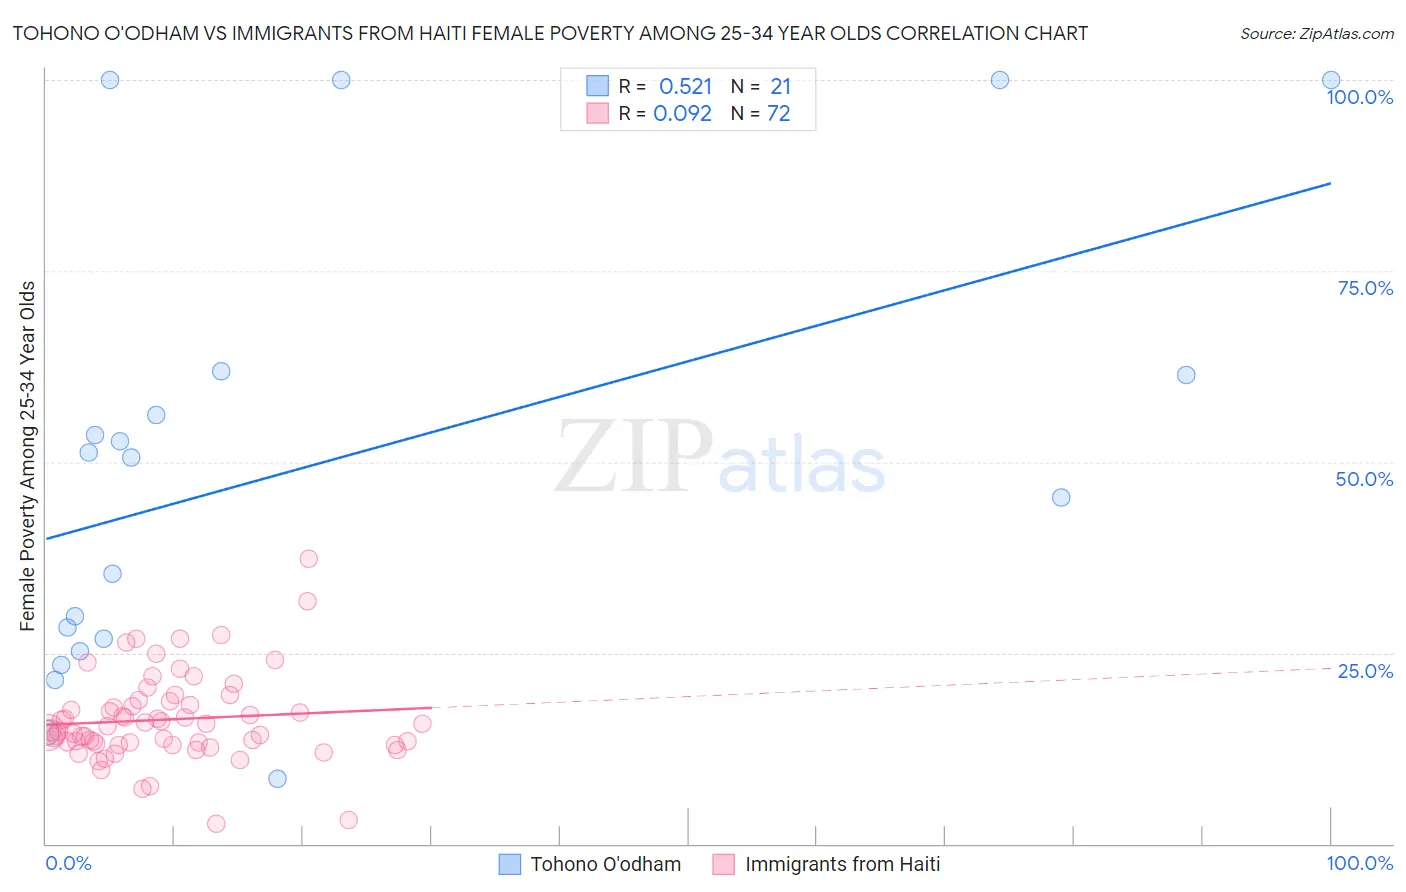
Tohono O'odham vs Immigrants from Haiti Female Poverty Among 25-34 Year Olds Correlation Chart
The statistical analysis conducted on geographies consisting of 58,640,962 people shows a substantial positive correlation between the proportion of Tohono O'odham and poverty level among females between the ages 25 and 34 in the United States with a correlation coefficient (R) of 0.521 and weighted average of 24.7%. Similarly, the statistical analysis conducted on geographies consisting of 223,141,441 people shows a slight positive correlation between the proportion of Immigrants from Haiti and poverty level among females between the ages 25 and 34 in the United States with a correlation coefficient (R) of 0.092 and weighted average of 15.0%, a difference of 64.9%.
Female Poverty Among 25-34 Year Olds Correlation Summary
| Measurement | Tohono O'odham | Immigrants from Haiti |
| Minimum | 8.6% | 2.6% |
| Maximum | 100.0% | 37.4% |
| Range | 91.4% | 34.8% |
| Mean | 49.8% | 16.3% |
| Median | 50.6% | 15.1% |
| Interquartile 25% (IQ1) | 26.0% | 13.1% |
| Interquartile 75% (IQ3) | 61.6% | 18.4% |
| Interquartile Range (IQR) | 35.6% | 5.3% |
| Standard Deviation (Sample) | 29.2% | 5.8% |
| Standard Deviation (Population) | 28.5% | 5.8% |
Similar Demographics by Female Poverty Among 25-34 Year Olds
Demographics Similar to Tohono O'odham by Female Poverty Among 25-34 Year Olds
In terms of female poverty among 25-34 year olds, the demographic groups most similar to Tohono O'odham are Yup'ik (24.3%, a difference of 1.8%), Pima (25.3%, a difference of 2.2%), Hopi (23.7%, a difference of 4.5%), Navajo (23.3%, a difference of 6.0%), and Lumbee (26.3%, a difference of 6.2%).
| Demographics | Rating | Rank | Female Poverty Among 25-34 Year Olds |
| Cajuns | 0.0 /100 | #333 | Tragic 19.9% |
| Apache | 0.0 /100 | #334 | Tragic 20.1% |
| Natives/Alaskans | 0.0 /100 | #335 | Tragic 20.3% |
| Pueblo | 0.0 /100 | #336 | Tragic 22.2% |
| Crow | 0.0 /100 | #337 | Tragic 22.7% |
| Houma | 0.0 /100 | #338 | Tragic 22.7% |
| Yuman | 0.0 /100 | #339 | Tragic 22.9% |
| Sioux | 0.0 /100 | #340 | Tragic 23.0% |
| Navajo | 0.0 /100 | #341 | Tragic 23.3% |
| Hopi | 0.0 /100 | #342 | Tragic 23.7% |
| Yup'ik | 0.0 /100 | #343 | Tragic 24.3% |
| Tohono O'odham | 0.0 /100 | #344 | Tragic 24.7% |
| Pima | 0.0 /100 | #345 | Tragic 25.3% |
| Lumbee | 0.0 /100 | #346 | Tragic 26.3% |
| Puerto Ricans | 0.0 /100 | #347 | Tragic 26.3% |
Demographics Similar to Immigrants from Haiti by Female Poverty Among 25-34 Year Olds
In terms of female poverty among 25-34 year olds, the demographic groups most similar to Immigrants from Haiti are Immigrants from El Salvador (15.0%, a difference of 0.030%), Haitian (15.0%, a difference of 0.22%), Belizean (15.1%, a difference of 0.39%), Immigrants from West Indies (15.1%, a difference of 0.53%), and Somali (15.1%, a difference of 0.61%).
| Demographics | Rating | Rank | Female Poverty Among 25-34 Year Olds |
| Barbadians | 1.2 /100 | #242 | Tragic 14.8% |
| Immigrants | Nicaragua | 1.1 /100 | #243 | Tragic 14.8% |
| Immigrants | Bangladesh | 1.1 /100 | #244 | Tragic 14.8% |
| Immigrants | Middle Africa | 1.0 /100 | #245 | Tragic 14.8% |
| Jamaicans | 1.0 /100 | #246 | Tragic 14.8% |
| German Russians | 0.8 /100 | #247 | Tragic 14.9% |
| Immigrants | Western Africa | 0.8 /100 | #248 | Tragic 14.9% |
| Immigrants | Haiti | 0.5 /100 | #249 | Tragic 15.0% |
| Immigrants | El Salvador | 0.5 /100 | #250 | Tragic 15.0% |
| Haitians | 0.5 /100 | #251 | Tragic 15.0% |
| Belizeans | 0.4 /100 | #252 | Tragic 15.1% |
| Immigrants | West Indies | 0.4 /100 | #253 | Tragic 15.1% |
| Somalis | 0.4 /100 | #254 | Tragic 15.1% |
| Immigrants | Laos | 0.3 /100 | #255 | Tragic 15.2% |
| West Indians | 0.3 /100 | #256 | Tragic 15.2% |