Tohono O'odham vs Yup'ik Female Poverty Among 25-34 Year Olds
COMPARE
Tohono O'odham
Yup'ik
Female Poverty Among 25-34 Year Olds
Female Poverty Among 25-34 Year Olds Comparison
Tohono O'odham
Yup'ik
24.7%
FEMALE POVERTY AMONG 25-34 YEAR OLDS
0.0/ 100
METRIC RATING
344th/ 347
METRIC RANK
24.3%
FEMALE POVERTY AMONG 25-34 YEAR OLDS
0.0/ 100
METRIC RATING
343rd/ 347
METRIC RANK
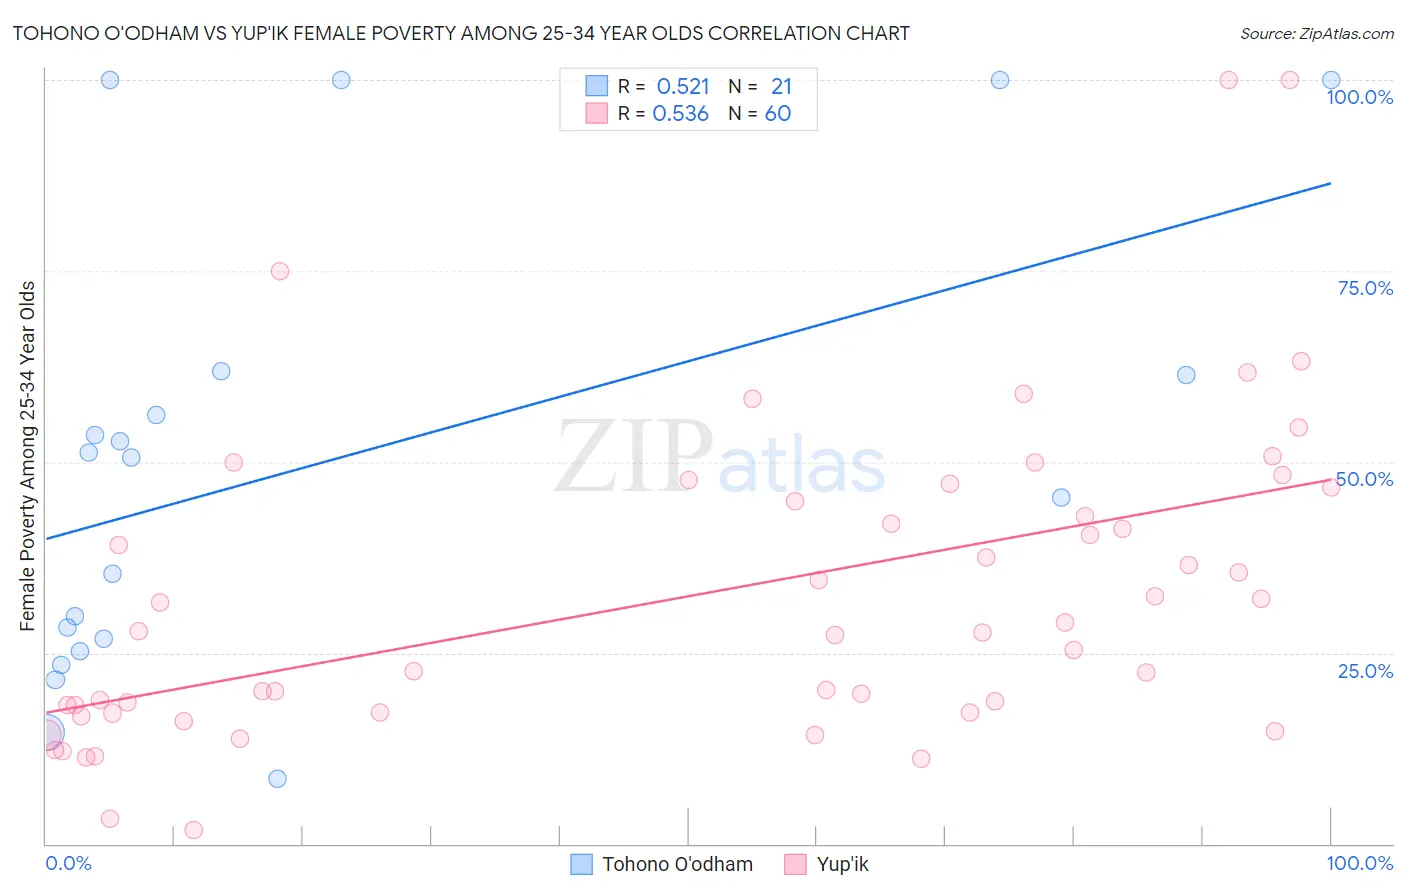
Tohono O'odham vs Yup'ik Female Poverty Among 25-34 Year Olds Correlation Chart
The statistical analysis conducted on geographies consisting of 58,640,962 people shows a substantial positive correlation between the proportion of Tohono O'odham and poverty level among females between the ages 25 and 34 in the United States with a correlation coefficient (R) of 0.521 and weighted average of 24.7%. Similarly, the statistical analysis conducted on geographies consisting of 39,877,637 people shows a substantial positive correlation between the proportion of Yup'ik and poverty level among females between the ages 25 and 34 in the United States with a correlation coefficient (R) of 0.536 and weighted average of 24.3%, a difference of 1.8%.
Female Poverty Among 25-34 Year Olds Correlation Summary
| Measurement | Tohono O'odham | Yup'ik |
| Minimum | 8.6% | 1.7% |
| Maximum | 100.0% | 100.0% |
| Range | 91.4% | 98.3% |
| Mean | 49.8% | 32.7% |
| Median | 50.6% | 27.7% |
| Interquartile 25% (IQ1) | 26.0% | 17.2% |
| Interquartile 75% (IQ3) | 61.6% | 45.7% |
| Interquartile Range (IQR) | 35.6% | 28.6% |
| Standard Deviation (Sample) | 29.2% | 20.8% |
| Standard Deviation (Population) | 28.5% | 20.6% |
Demographics Similar to Tohono O'odham and Yup'ik by Female Poverty Among 25-34 Year Olds
In terms of female poverty among 25-34 year olds, the demographic groups most similar to Tohono O'odham are Pima (25.3%, a difference of 2.2%), Hopi (23.7%, a difference of 4.5%), Navajo (23.3%, a difference of 6.0%), Lumbee (26.3%, a difference of 6.2%), and Puerto Rican (26.3%, a difference of 6.2%). Similarly, the demographic groups most similar to Yup'ik are Hopi (23.7%, a difference of 2.7%), Pima (25.3%, a difference of 4.1%), Navajo (23.3%, a difference of 4.1%), Sioux (23.0%, a difference of 5.9%), and Yuman (22.9%, a difference of 6.1%).
| Demographics | Rating | Rank | Female Poverty Among 25-34 Year Olds |
| Alaskan Athabascans | 0.0 /100 | #328 | Tragic 19.1% |
| Creek | 0.0 /100 | #329 | Tragic 19.2% |
| Paiute | 0.0 /100 | #330 | Tragic 19.6% |
| Kiowa | 0.0 /100 | #331 | Tragic 19.7% |
| Immigrants | Yemen | 0.0 /100 | #332 | Tragic 19.8% |
| Cajuns | 0.0 /100 | #333 | Tragic 19.9% |
| Apache | 0.0 /100 | #334 | Tragic 20.1% |
| Natives/Alaskans | 0.0 /100 | #335 | Tragic 20.3% |
| Pueblo | 0.0 /100 | #336 | Tragic 22.2% |
| Crow | 0.0 /100 | #337 | Tragic 22.7% |
| Houma | 0.0 /100 | #338 | Tragic 22.7% |
| Yuman | 0.0 /100 | #339 | Tragic 22.9% |
| Sioux | 0.0 /100 | #340 | Tragic 23.0% |
| Navajo | 0.0 /100 | #341 | Tragic 23.3% |
| Hopi | 0.0 /100 | #342 | Tragic 23.7% |
| Yup'ik | 0.0 /100 | #343 | Tragic 24.3% |
| Tohono O'odham | 0.0 /100 | #344 | Tragic 24.7% |
| Pima | 0.0 /100 | #345 | Tragic 25.3% |
| Lumbee | 0.0 /100 | #346 | Tragic 26.3% |
| Puerto Ricans | 0.0 /100 | #347 | Tragic 26.3% |