Tlingit-Haida vs Immigrants from Middle Africa Receiving Food Stamps

COMPARE

Tlingit-Haida
Race
Ancestry
AfghanAfricanAlaska NativeAlaskan AthabascanAlbanianAleutAlsatianAmericanApacheArabArapahoArgentineanArmenianAssyrian/Chaldean/SyriacAustralianAustrianBahamianBangladeshiBarbadianBasqueBelgianBelizeanBermudanBhutaneseBlackfeetBolivianBrazilianBritishBritish West IndianBulgarianBurmeseCajunCambodianCanadianCape VerdeanCarpatho RusynCelticCentral AmericanCentral American IndianCherokeeCheyenneChickasawChileanChineseChippewaChoctawColombianColvilleComancheCosta RicanCreeCreekCroatianCrowCubanCypriotCzechCzechoslovakianDanishDelawareDominicanDutchDutch West IndianEastern EuropeanEcuadorianEgyptianEnglishEstonianEthiopianEuropeanFijianFilipinoFinnishFrenchFrench American IndianFrench CanadianGermanGerman RussianGhanaianGreekGuamanian/ChamorroGuatemalanGuyaneseHaitianHmongHonduranHopiHoumaHungarianIcelanderIndian (Asian)IndonesianInupiatIranianIraqiIrishIroquoisIsraeliItalianJamaicanJapaneseJordanianKenyanKiowaKoreanLaotianLatvianLebaneseLiberianLithuanianLumbeeLuxembourgerMacedonianMalaysianMalteseMarshalleseMenomineeMexicanMexican American IndianMongolianMoroccanNative HawaiianNavajoNepaleseNew ZealanderNicaraguanNigerianNorthern EuropeanNorwegianOkinawanOsageOttawaPaiutePakistaniPalestinianPanamanianParaguayanPennsylvania GermanPeruvianPimaPolishPortuguesePotawatomiPuebloPuerto RicanPuget Sound SalishRomanianRussianSalvadoranSamoanScandinavianScotch-IrishScottishSeminoleSenegaleseSerbianShoshoneSierra LeoneanSiouxSlavicSlovakSloveneSomaliSouth AfricanSouth AmericanSouth American IndianSoviet UnionSpaniardSpanishSpanish AmericanSpanish American IndianSri LankanSubsaharan AfricanSudaneseSwedishSwissSyrianTaiwaneseThaiTlingit-HaidaTohono O'OdhamTonganTrinidadian and TobagonianTsimshianTurkishU.S. Virgin IslanderUgandanUkrainianUruguayanUteVenezuelanVietnameseWelshWest IndianYakamaYaquiYugoslavianYumanYup'ikZimbabwean
Immigration
NonimmigrantsImmigrantsAfghanistanAfricaAlbaniaArgentinaArmeniaAsiaAustraliaAustriaBahamasBangladeshBarbadosBelarusBelgiumBelizeBoliviaBosnia and HerzegovinaBrazilBulgariaBurma/MyanmarCabo VerdeCambodiaCameroonCanadaCaribbeanCentral AmericaChileChinaColombiaCongoCosta RicaCroatiaCubaCzechoslovakiaDenmarkDominicaDominican RepublicEastern AfricaEastern AsiaEastern EuropeEcuadorEgyptEl SalvadorEnglandEritreaEthiopiaEuropeFijiFranceGermanyGhanaGreeceGrenadaGuatemalaGuyanaHaitiHondurasHong KongHungaryIndiaIndonesiaIranIraqIrelandIsraelItalyJamaicaJapanJordanKazakhstanKenyaKoreaKuwaitLaosLatin AmericaLatviaLebanonLiberiaLithuaniaMalaysiaMexicoMicronesiaMoldovaMoroccoNepalNetherlandsNicaraguaNigeriaNorth AmericaNorth MacedoniaNorthern AfricaNorthern EuropeNorwayOceaniaPakistanPanamaPeruPhilippinesPolandPortugalRomaniaRussiaSaudi ArabiaScotlandSenegalSerbiaSierra LeoneSingaporeSomaliaSouth AfricaSouth AmericaSouth Central AsiaSouth Eastern AsiaSouthern EuropeSpainSri LankaSt. Vincent and the GrenadinesSudanSwedenSwitzerlandSyriaTaiwanThailandTrinidad and TobagoTurkeyUgandaUkraineUruguayUzbekistanVenezuelaVietnamWest IndiesWestern AfricaWestern AsiaWestern EuropeYemenZaireZimbabweAzores
Immigrants from Middle Africa
Race
Ancestry
AfghanAfricanAlaska NativeAlaskan AthabascanAlbanianAleutAlsatianAmericanApacheArabArapahoArgentineanArmenianAssyrian/Chaldean/SyriacAustralianAustrianBahamianBangladeshiBarbadianBasqueBelgianBelizeanBermudanBhutaneseBlackfeetBolivianBrazilianBritishBritish West IndianBulgarianBurmeseCajunCambodianCanadianCape VerdeanCarpatho RusynCelticCentral AmericanCentral American IndianCherokeeCheyenneChickasawChileanChineseChippewaChoctawColombianColvilleComancheCosta RicanCreeCreekCroatianCrowCubanCypriotCzechCzechoslovakianDanishDelawareDominicanDutchDutch West IndianEastern EuropeanEcuadorianEgyptianEnglishEstonianEthiopianEuropeanFijianFilipinoFinnishFrenchFrench American IndianFrench CanadianGermanGerman RussianGhanaianGreekGuamanian/ChamorroGuatemalanGuyaneseHaitianHmongHonduranHopiHoumaHungarianIcelanderIndian (Asian)IndonesianInupiatIranianIraqiIrishIroquoisIsraeliItalianJamaicanJapaneseJordanianKenyanKiowaKoreanLaotianLatvianLebaneseLiberianLithuanianLumbeeLuxembourgerMacedonianMalaysianMalteseMarshalleseMenomineeMexicanMexican American IndianMongolianMoroccanNative HawaiianNavajoNepaleseNew ZealanderNicaraguanNigerianNorthern EuropeanNorwegianOkinawanOsageOttawaPaiutePakistaniPalestinianPanamanianParaguayanPennsylvania GermanPeruvianPimaPolishPortuguesePotawatomiPuebloPuerto RicanPuget Sound SalishRomanianRussianSalvadoranSamoanScandinavianScotch-IrishScottishSeminoleSenegaleseSerbianShoshoneSierra LeoneanSiouxSlavicSlovakSloveneSomaliSouth AfricanSouth AmericanSouth American IndianSoviet UnionSpaniardSpanishSpanish AmericanSpanish American IndianSri LankanSubsaharan AfricanSudaneseSwedishSwissSyrianTaiwaneseThaiTohono O'OdhamTonganTrinidadian and TobagonianTsimshianTurkishU.S. Virgin IslanderUgandanUkrainianUruguayanUteVenezuelanVietnameseWelshWest IndianYakamaYaquiYugoslavianYumanYup'ikZimbabwean
Immigration
NonimmigrantsImmigrantsAfghanistanAfricaAlbaniaArgentinaArmeniaAsiaAustraliaAustriaBahamasBangladeshBarbadosBelarusBelgiumBelizeBoliviaBosnia and HerzegovinaBrazilBulgariaBurma/MyanmarCabo VerdeCambodiaCameroonCanadaCaribbeanCentral AmericaChileChinaColombiaCongoCosta RicaCroatiaCubaCzechoslovakiaDenmarkDominicaDominican RepublicEastern AfricaEastern AsiaEastern EuropeEcuadorEgyptEl SalvadorEnglandEritreaEthiopiaEuropeFijiFranceGermanyGhanaGreeceGrenadaGuatemalaGuyanaHaitiHondurasHong KongHungaryIndiaIndonesiaIranIraqIrelandIsraelItalyJamaicaJapanJordanKazakhstanKenyaKoreaKuwaitLaosLatin AmericaLatviaLebanonLiberiaLithuaniaMalaysiaMexicoMicronesiaMiddle AfricaMoldovaMoroccoNepalNetherlandsNicaraguaNigeriaNorth AmericaNorth MacedoniaNorthern AfricaNorthern EuropeNorwayOceaniaPakistanPanamaPeruPhilippinesPolandPortugalRomaniaRussiaSaudi ArabiaScotlandSenegalSerbiaSierra LeoneSingaporeSomaliaSouth AfricaSouth AmericaSouth Central AsiaSouth Eastern AsiaSouthern EuropeSpainSri LankaSt. Vincent and the GrenadinesSudanSwedenSwitzerlandSyriaTaiwanThailandTrinidad and TobagoTurkeyUgandaUkraineUruguayUzbekistanVenezuelaVietnamWest IndiesWestern AfricaWestern AsiaWestern EuropeYemenZaireZimbabweAzores
Receiving Food Stamps
Income
Poverty
Unemployment
Labor Participation
Family Structure
Vehicle Availability
Education Level
Disability

Receiving Food Stamps Comparison

Tlingit-Haida

Immigrants from Middle Africa

Average
Tragic
11.6%
RECEIVING FOOD STAMPS
59.1/ 100
METRIC RATING
168th/ 347
METRIC RANK
12.9%
RECEIVING FOOD STAMPS
5.4/ 100
METRIC RATING
219th/ 347
METRIC RANK

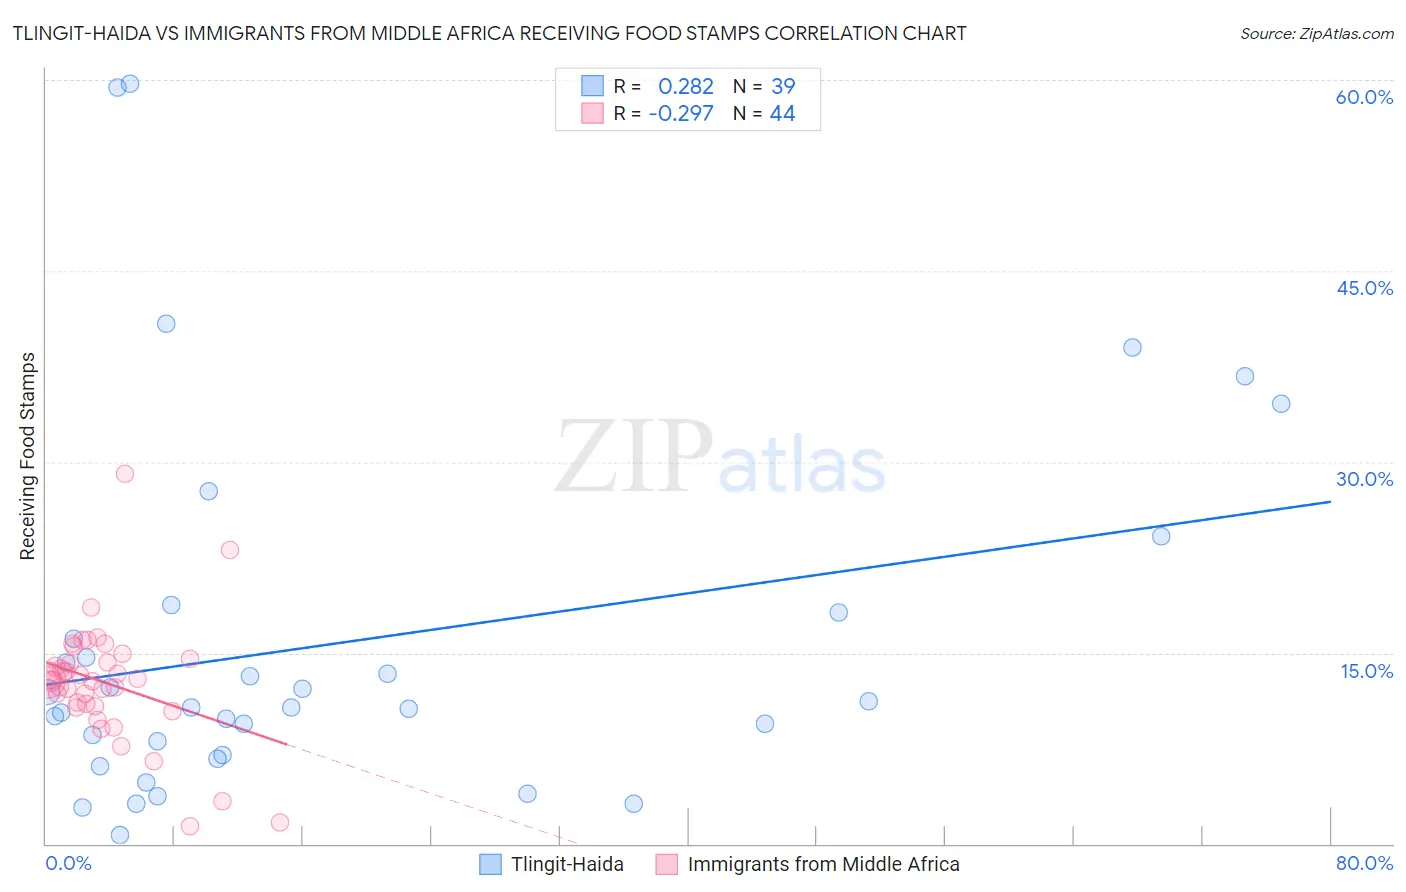
Tlingit-Haida vs Immigrants from Middle Africa Receiving Food Stamps Correlation Chart

The statistical analysis conducted on geographies consisting of 60,831,023 people shows a weak positive correlation between the proportion of Tlingit-Haida and percentage of population receiving government assistance and/or food stamps in the United States with a correlation coefficient (R) of 0.282 and weighted average of 11.6%. Similarly, the statistical analysis conducted on geographies consisting of 202,565,128 people shows a weak negative correlation between the proportion of Immigrants from Middle Africa and percentage of population receiving government assistance and/or food stamps in the United States with a correlation coefficient (R) of -0.297 and weighted average of 12.9%, a difference of 11.5%.
Tlingit-Haida vs Immigrants from Middle Africa Receiving Food Stamps

Receiving Food Stamps Correlation Summary

MeasurementTlingit-HaidaImmigrants from Middle Africa
Minimum0.70%1.4%
Maximum59.7%29.1%
Range59.0%27.7%
Mean15.8%12.7%
Median10.7%12.9%
Interquartile 25% (IQ1)7.0%10.9%
Interquartile 75% (IQ3)18.2%14.3%
Interquartile Range (IQR)11.2%3.4%
Standard Deviation (Sample)14.4%4.7%
Standard Deviation (Population)14.2%4.6%

Similar Demographics by Receiving Food Stamps

Demographics Similar to Tlingit-Haida by Receiving Food Stamps

In terms of receiving food stamps, the demographic groups most similar to Tlingit-Haida are Immigrants from Eastern Africa (11.6%, a difference of 0.12%), Kenyan (11.6%, a difference of 0.16%), Costa Rican (11.6%, a difference of 0.18%), Immigrants from Western Asia (11.6%, a difference of 0.40%), and Immigrants from Belarus (11.5%, a difference of 0.54%).
DemographicsRating | RankReceiving Food Stamps
Pennsylvania Germans
68.4
/100
|
#161
Good
11.4%
Alsatians
68.0
/100
|
#162
Good
11.4%
Immigrants | Southern Europe
65.8
/100
|
#163
Good
11.5%
Immigrants | Chile
65.0
/100
|
#164
Good
11.5%
Arabs
64.7
/100
|
#165
Good
11.5%
Immigrants | Belarus
62.8
/100
|
#166
Good
11.5%
Kenyans
60.2
/100
|
#167
Good
11.6%
Tlingit-Haida
59.1
/100
|
#168
Average
11.6%
Immigrants | Eastern Africa
58.3
/100
|
#169
Average
11.6%
Costa Ricans
57.9
/100
|
#170
Average
11.6%
Immigrants | Western Asia
56.4
/100
|
#171
Average
11.6%
Guamanians/Chamorros
54.2
/100
|
#172
Average
11.7%
Immigrants | Syria
53.4
/100
|
#173
Average
11.7%
Immigrants | Eritrea
50.0
/100
|
#174
Average
11.7%
Osage
49.8
/100
|
#175
Average
11.7%

Demographics Similar to Immigrants from Middle Africa by Receiving Food Stamps

In terms of receiving food stamps, the demographic groups most similar to Immigrants from Middle Africa are Hawaiian (12.9%, a difference of 0.010%), Immigrants from Colombia (12.9%, a difference of 0.040%), Bermudan (13.0%, a difference of 0.36%), Immigrants from Burma/Myanmar (12.9%, a difference of 0.38%), and Immigrants (13.0%, a difference of 0.62%).
DemographicsRating | RankReceiving Food Stamps
Malaysians
8.5
/100
|
#212
Tragic
12.7%
Moroccans
7.6
/100
|
#213
Tragic
12.8%
Immigrants | Africa
7.6
/100
|
#214
Tragic
12.8%
Native Hawaiians
6.7
/100
|
#215
Tragic
12.8%
Immigrants | South America
6.5
/100
|
#216
Tragic
12.8%
Immigrants | Burma/Myanmar
6.0
/100
|
#217
Tragic
12.9%
Hawaiians
5.4
/100
|
#218
Tragic
12.9%
Immigrants | Middle Africa
5.4
/100
|
#219
Tragic
12.9%
Immigrants | Colombia
5.3
/100
|
#220
Tragic
12.9%
Bermudans
4.8
/100
|
#221
Tragic
13.0%
Immigrants | Immigrants
4.4
/100
|
#222
Tragic
13.0%
Immigrants | Albania
4.4
/100
|
#223
Tragic
13.0%
Immigrants | Armenia
4.3
/100
|
#224
Tragic
13.0%
Fijians
4.3
/100
|
#225
Tragic
13.0%
Chickasaw
3.6
/100
|
#226
Tragic
13.1%