Tlingit-Haida vs Immigrants from Scotland Seniors Poverty Over the Age of 75
COMPARE
Tlingit-Haida
Immigrants from Scotland
Seniors Poverty Over the Age of 75
Seniors Poverty Over the Age of 75 Comparison
Tlingit-Haida
Immigrants from Scotland
9.7%
SENIORS POVERTY OVER THE AGE OF 75
100.0/ 100
METRIC RATING
2nd/ 347
METRIC RANK
10.5%
SENIORS POVERTY OVER THE AGE OF 75
99.9/ 100
METRIC RATING
19th/ 347
METRIC RANK
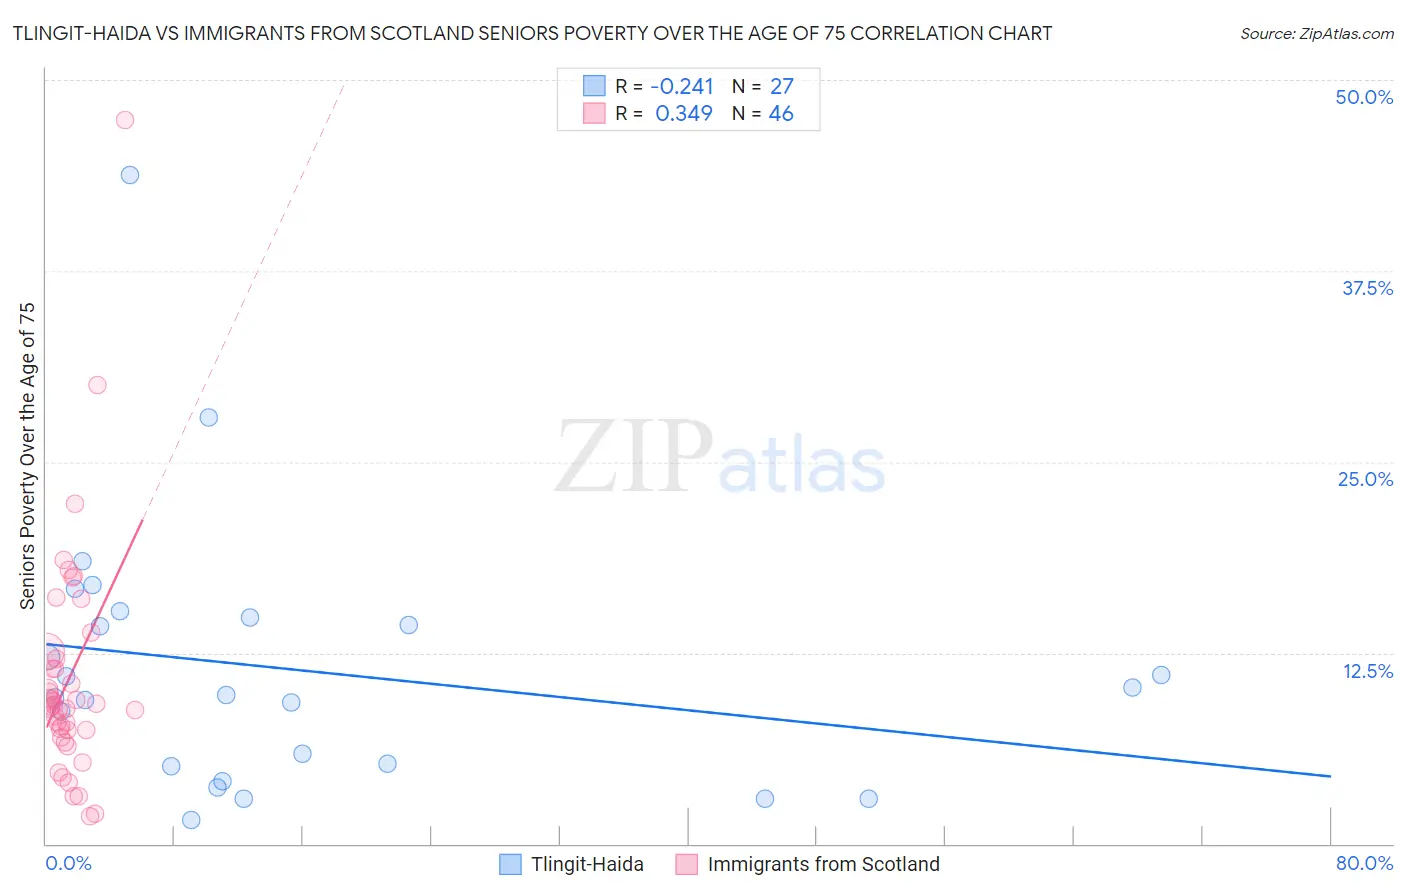
Tlingit-Haida vs Immigrants from Scotland Seniors Poverty Over the Age of 75 Correlation Chart
The statistical analysis conducted on geographies consisting of 60,526,405 people shows a weak negative correlation between the proportion of Tlingit-Haida and poverty level among seniors over the age of 75 in the United States with a correlation coefficient (R) of -0.241 and weighted average of 9.7%. Similarly, the statistical analysis conducted on geographies consisting of 195,397,076 people shows a mild positive correlation between the proportion of Immigrants from Scotland and poverty level among seniors over the age of 75 in the United States with a correlation coefficient (R) of 0.349 and weighted average of 10.5%, a difference of 8.7%.
Seniors Poverty Over the Age of 75 Correlation Summary
| Measurement | Tlingit-Haida | Immigrants from Scotland |
| Minimum | 1.5% | 1.8% |
| Maximum | 43.8% | 47.4% |
| Range | 42.2% | 45.5% |
| Mean | 11.4% | 10.8% |
| Median | 9.7% | 9.0% |
| Interquartile 25% (IQ1) | 5.0% | 7.4% |
| Interquartile 75% (IQ3) | 14.8% | 12.1% |
| Interquartile Range (IQR) | 9.8% | 4.7% |
| Standard Deviation (Sample) | 8.8% | 7.7% |
| Standard Deviation (Population) | 8.7% | 7.6% |
Demographics Similar to Tlingit-Haida and Immigrants from Scotland by Seniors Poverty Over the Age of 75
In terms of seniors poverty over the age of 75, the demographic groups most similar to Tlingit-Haida are Native Hawaiian (10.1%, a difference of 3.8%), Swedish (10.2%, a difference of 4.7%), Norwegian (10.2%, a difference of 5.1%), Danish (10.2%, a difference of 5.4%), and Maltese (10.3%, a difference of 6.1%). Similarly, the demographic groups most similar to Immigrants from Scotland are Czech (10.5%, a difference of 0.020%), Slovak (10.5%, a difference of 0.040%), Welsh (10.5%, a difference of 0.040%), Dutch (10.5%, a difference of 0.25%), and Scottish (10.5%, a difference of 0.37%).
| Demographics | Rating | Rank | Seniors Poverty Over the Age of 75 |
| Chinese | 100.0 /100 | #1 | Exceptional 9.1% |
| Tlingit-Haida | 100.0 /100 | #2 | Exceptional 9.7% |
| Native Hawaiians | 100.0 /100 | #3 | Exceptional 10.1% |
| Swedes | 100.0 /100 | #4 | Exceptional 10.2% |
| Norwegians | 100.0 /100 | #5 | Exceptional 10.2% |
| Danes | 100.0 /100 | #6 | Exceptional 10.2% |
| Maltese | 100.0 /100 | #7 | Exceptional 10.3% |
| Germans | 99.9 /100 | #8 | Exceptional 10.4% |
| English | 99.9 /100 | #9 | Exceptional 10.4% |
| Scandinavians | 99.9 /100 | #10 | Exceptional 10.4% |
| Immigrants | India | 99.9 /100 | #11 | Exceptional 10.4% |
| Tongans | 99.9 /100 | #12 | Exceptional 10.5% |
| Croatians | 99.9 /100 | #13 | Exceptional 10.5% |
| Scottish | 99.9 /100 | #14 | Exceptional 10.5% |
| Europeans | 99.9 /100 | #15 | Exceptional 10.5% |
| Dutch | 99.9 /100 | #16 | Exceptional 10.5% |
| Slovaks | 99.9 /100 | #17 | Exceptional 10.5% |
| Welsh | 99.9 /100 | #18 | Exceptional 10.5% |
| Immigrants | Scotland | 99.9 /100 | #19 | Exceptional 10.5% |
| Czechs | 99.9 /100 | #20 | Exceptional 10.5% |