Fijian vs Bahamian Seniors Poverty Over the Age of 75
COMPARE
Fijian
Bahamian
Seniors Poverty Over the Age of 75
Seniors Poverty Over the Age of 75 Comparison
Fijians
Bahamians
11.8%
SENIORS POVERTY OVER THE AGE OF 75
83.8/ 100
METRIC RATING
124th/ 347
METRIC RANK
15.5%
SENIORS POVERTY OVER THE AGE OF 75
0.0/ 100
METRIC RATING
300th/ 347
METRIC RANK
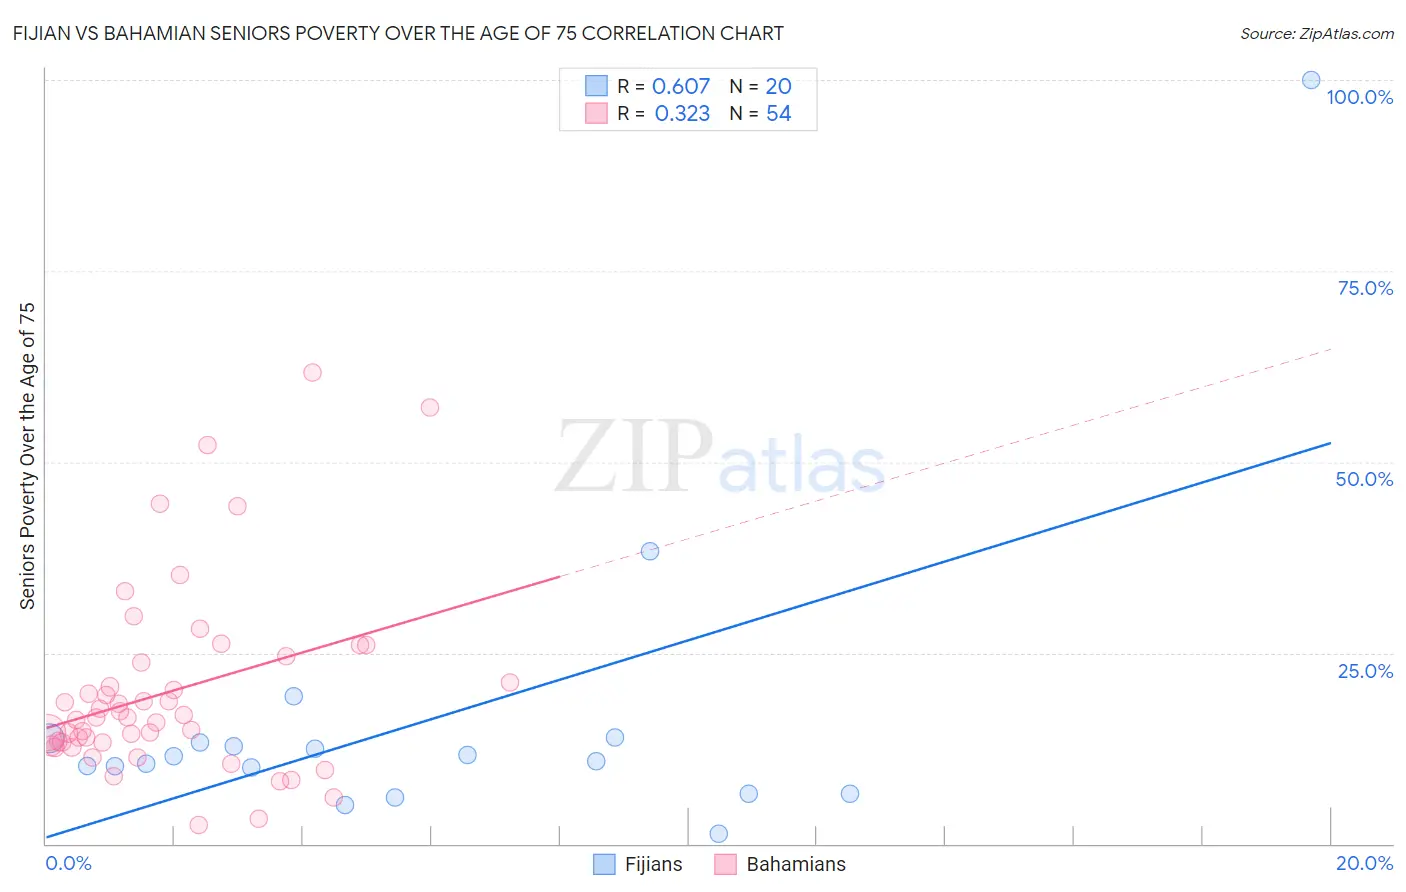
Fijian vs Bahamian Seniors Poverty Over the Age of 75 Correlation Chart
The statistical analysis conducted on geographies consisting of 55,762,719 people shows a significant positive correlation between the proportion of Fijians and poverty level among seniors over the age of 75 in the United States with a correlation coefficient (R) of 0.607 and weighted average of 11.8%. Similarly, the statistical analysis conducted on geographies consisting of 112,239,118 people shows a mild positive correlation between the proportion of Bahamians and poverty level among seniors over the age of 75 in the United States with a correlation coefficient (R) of 0.323 and weighted average of 15.5%, a difference of 31.7%.
Seniors Poverty Over the Age of 75 Correlation Summary
| Measurement | Fijian | Bahamian |
| Minimum | 1.2% | 2.5% |
| Maximum | 100.0% | 61.7% |
| Range | 98.8% | 59.2% |
| Mean | 16.2% | 20.0% |
| Median | 11.1% | 16.5% |
| Interquartile 25% (IQ1) | 8.2% | 13.3% |
| Interquartile 75% (IQ3) | 13.5% | 23.7% |
| Interquartile Range (IQR) | 5.3% | 10.4% |
| Standard Deviation (Sample) | 21.1% | 12.4% |
| Standard Deviation (Population) | 20.5% | 12.3% |
Similar Demographics by Seniors Poverty Over the Age of 75
Demographics Similar to Fijians by Seniors Poverty Over the Age of 75
In terms of seniors poverty over the age of 75, the demographic groups most similar to Fijians are Pakistani (11.8%, a difference of 0.030%), Immigrants from Italy (11.8%, a difference of 0.030%), Sudanese (11.8%, a difference of 0.030%), Malaysian (11.8%, a difference of 0.040%), and Pennsylvania German (11.8%, a difference of 0.060%).
| Demographics | Rating | Rank | Seniors Poverty Over the Age of 75 |
| Icelanders | 85.7 /100 | #117 | Excellent 11.7% |
| Immigrants | Zimbabwe | 85.5 /100 | #118 | Excellent 11.7% |
| Immigrants | Uganda | 84.8 /100 | #119 | Excellent 11.8% |
| Immigrants | Nepal | 84.5 /100 | #120 | Excellent 11.8% |
| Malaysians | 84.1 /100 | #121 | Excellent 11.8% |
| Pakistanis | 84.0 /100 | #122 | Excellent 11.8% |
| Immigrants | Italy | 84.0 /100 | #123 | Excellent 11.8% |
| Fijians | 83.8 /100 | #124 | Excellent 11.8% |
| Sudanese | 83.6 /100 | #125 | Excellent 11.8% |
| Pennsylvania Germans | 83.4 /100 | #126 | Excellent 11.8% |
| Immigrants | Denmark | 82.6 /100 | #127 | Excellent 11.8% |
| Immigrants | Hungary | 81.7 /100 | #128 | Excellent 11.8% |
| Ethiopians | 80.7 /100 | #129 | Excellent 11.8% |
| Spanish | 80.5 /100 | #130 | Excellent 11.8% |
| Immigrants | Western Europe | 79.6 /100 | #131 | Good 11.9% |
Demographics Similar to Bahamians by Seniors Poverty Over the Age of 75
In terms of seniors poverty over the age of 75, the demographic groups most similar to Bahamians are Spanish American Indian (15.5%, a difference of 0.010%), Native/Alaskan (15.5%, a difference of 0.11%), Honduran (15.4%, a difference of 0.45%), Yuman (15.4%, a difference of 0.73%), and Immigrants from Latin America (15.6%, a difference of 0.78%).
| Demographics | Rating | Rank | Seniors Poverty Over the Age of 75 |
| Apache | 0.0 /100 | #293 | Tragic 15.3% |
| Immigrants | Jamaica | 0.0 /100 | #294 | Tragic 15.3% |
| U.S. Virgin Islanders | 0.0 /100 | #295 | Tragic 15.4% |
| Yuman | 0.0 /100 | #296 | Tragic 15.4% |
| Hondurans | 0.0 /100 | #297 | Tragic 15.4% |
| Natives/Alaskans | 0.0 /100 | #298 | Tragic 15.5% |
| Spanish American Indians | 0.0 /100 | #299 | Tragic 15.5% |
| Bahamians | 0.0 /100 | #300 | Tragic 15.5% |
| Immigrants | Latin America | 0.0 /100 | #301 | Tragic 15.6% |
| West Indians | 0.0 /100 | #302 | Tragic 15.7% |
| Immigrants | Honduras | 0.0 /100 | #303 | Tragic 15.7% |
| Immigrants | Trinidad and Tobago | 0.0 /100 | #304 | Tragic 15.7% |
| Ecuadorians | 0.0 /100 | #305 | Tragic 15.7% |
| Hispanics or Latinos | 0.0 /100 | #306 | Tragic 15.8% |
| Immigrants | West Indies | 0.0 /100 | #307 | Tragic 15.8% |