Immigrants from Saudi Arabia vs Bahamian Seniors Poverty Over the Age of 75
COMPARE
Immigrants from Saudi Arabia
Bahamian
Seniors Poverty Over the Age of 75
Seniors Poverty Over the Age of 75 Comparison
Immigrants from Saudi Arabia
Bahamians
12.2%
SENIORS POVERTY OVER THE AGE OF 75
49.5/ 100
METRIC RATING
175th/ 347
METRIC RANK
15.5%
SENIORS POVERTY OVER THE AGE OF 75
0.0/ 100
METRIC RATING
300th/ 347
METRIC RANK
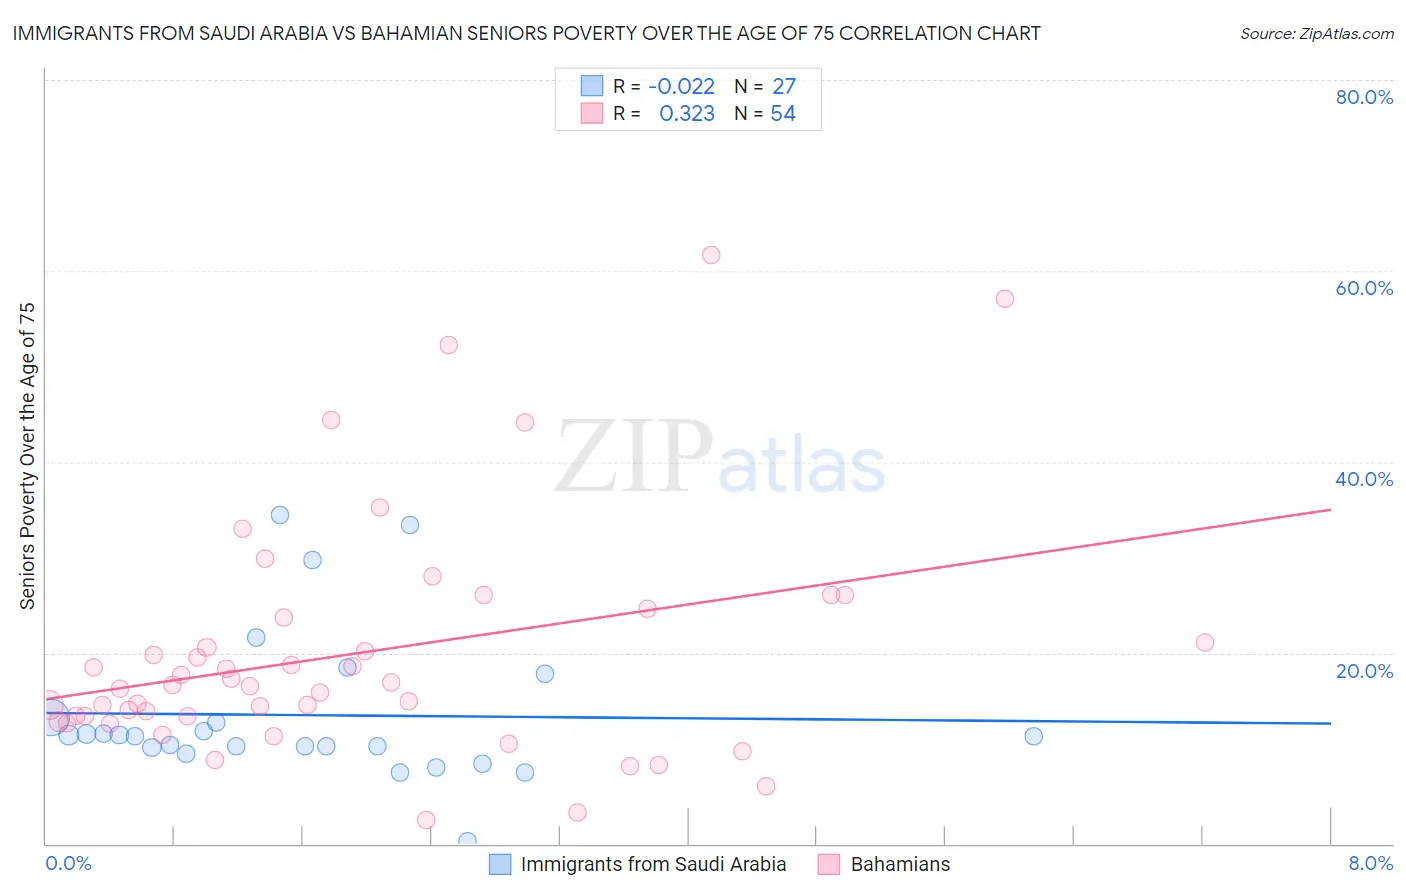
Immigrants from Saudi Arabia vs Bahamian Seniors Poverty Over the Age of 75 Correlation Chart
The statistical analysis conducted on geographies consisting of 163,448,927 people shows no correlation between the proportion of Immigrants from Saudi Arabia and poverty level among seniors over the age of 75 in the United States with a correlation coefficient (R) of -0.022 and weighted average of 12.2%. Similarly, the statistical analysis conducted on geographies consisting of 112,239,118 people shows a mild positive correlation between the proportion of Bahamians and poverty level among seniors over the age of 75 in the United States with a correlation coefficient (R) of 0.323 and weighted average of 15.5%, a difference of 27.2%.
Seniors Poverty Over the Age of 75 Correlation Summary
| Measurement | Immigrants from Saudi Arabia | Bahamian |
| Minimum | 0.23% | 2.5% |
| Maximum | 34.4% | 61.7% |
| Range | 34.2% | 59.2% |
| Mean | 13.5% | 20.0% |
| Median | 11.3% | 16.5% |
| Interquartile 25% (IQ1) | 10.1% | 13.3% |
| Interquartile 75% (IQ3) | 13.3% | 23.7% |
| Interquartile Range (IQR) | 3.2% | 10.4% |
| Standard Deviation (Sample) | 7.9% | 12.4% |
| Standard Deviation (Population) | 7.8% | 12.3% |
Similar Demographics by Seniors Poverty Over the Age of 75
Demographics Similar to Immigrants from Saudi Arabia by Seniors Poverty Over the Age of 75
In terms of seniors poverty over the age of 75, the demographic groups most similar to Immigrants from Saudi Arabia are Immigrants from Europe (12.2%, a difference of 0.040%), Arab (12.2%, a difference of 0.080%), Immigrants from Iran (12.2%, a difference of 0.11%), Immigrants from Asia (12.2%, a difference of 0.13%), and Spaniard (12.2%, a difference of 0.17%).
| Demographics | Rating | Rank | Seniors Poverty Over the Age of 75 |
| Immigrants | Syria | 53.9 /100 | #168 | Average 12.2% |
| Immigrants | Egypt | 53.7 /100 | #169 | Average 12.2% |
| Immigrants | Thailand | 52.0 /100 | #170 | Average 12.2% |
| Spaniards | 51.6 /100 | #171 | Average 12.2% |
| Immigrants | Fiji | 51.5 /100 | #172 | Average 12.2% |
| Arabs | 50.5 /100 | #173 | Average 12.2% |
| Immigrants | Europe | 50.0 /100 | #174 | Average 12.2% |
| Immigrants | Saudi Arabia | 49.5 /100 | #175 | Average 12.2% |
| Immigrants | Iran | 48.1 /100 | #176 | Average 12.2% |
| Immigrants | Asia | 47.8 /100 | #177 | Average 12.2% |
| Immigrants | Nonimmigrants | 46.8 /100 | #178 | Average 12.2% |
| Mongolians | 45.5 /100 | #179 | Average 12.2% |
| Immigrants | South Eastern Asia | 44.3 /100 | #180 | Average 12.2% |
| Immigrants | Australia | 44.2 /100 | #181 | Average 12.2% |
| German Russians | 41.4 /100 | #182 | Average 12.3% |
Demographics Similar to Bahamians by Seniors Poverty Over the Age of 75
In terms of seniors poverty over the age of 75, the demographic groups most similar to Bahamians are Spanish American Indian (15.5%, a difference of 0.010%), Native/Alaskan (15.5%, a difference of 0.11%), Honduran (15.4%, a difference of 0.45%), Yuman (15.4%, a difference of 0.73%), and Immigrants from Latin America (15.6%, a difference of 0.78%).
| Demographics | Rating | Rank | Seniors Poverty Over the Age of 75 |
| Apache | 0.0 /100 | #293 | Tragic 15.3% |
| Immigrants | Jamaica | 0.0 /100 | #294 | Tragic 15.3% |
| U.S. Virgin Islanders | 0.0 /100 | #295 | Tragic 15.4% |
| Yuman | 0.0 /100 | #296 | Tragic 15.4% |
| Hondurans | 0.0 /100 | #297 | Tragic 15.4% |
| Natives/Alaskans | 0.0 /100 | #298 | Tragic 15.5% |
| Spanish American Indians | 0.0 /100 | #299 | Tragic 15.5% |
| Bahamians | 0.0 /100 | #300 | Tragic 15.5% |
| Immigrants | Latin America | 0.0 /100 | #301 | Tragic 15.6% |
| West Indians | 0.0 /100 | #302 | Tragic 15.7% |
| Immigrants | Honduras | 0.0 /100 | #303 | Tragic 15.7% |
| Immigrants | Trinidad and Tobago | 0.0 /100 | #304 | Tragic 15.7% |
| Ecuadorians | 0.0 /100 | #305 | Tragic 15.7% |
| Hispanics or Latinos | 0.0 /100 | #306 | Tragic 15.8% |
| Immigrants | West Indies | 0.0 /100 | #307 | Tragic 15.8% |