Immigrants from Jordan vs African Child Poverty Under the Age of 5
COMPARE
Immigrants from Jordan
African
Child Poverty Under the Age of 5
Child Poverty Under the Age of 5 Comparison
Immigrants from Jordan
Africans
16.1%
CHILD POVERTY UNDER THE AGE OF 5
93.2/ 100
METRIC RATING
119th/ 347
METRIC RANK
22.8%
CHILD POVERTY UNDER THE AGE OF 5
0.0/ 100
METRIC RATING
310th/ 347
METRIC RANK
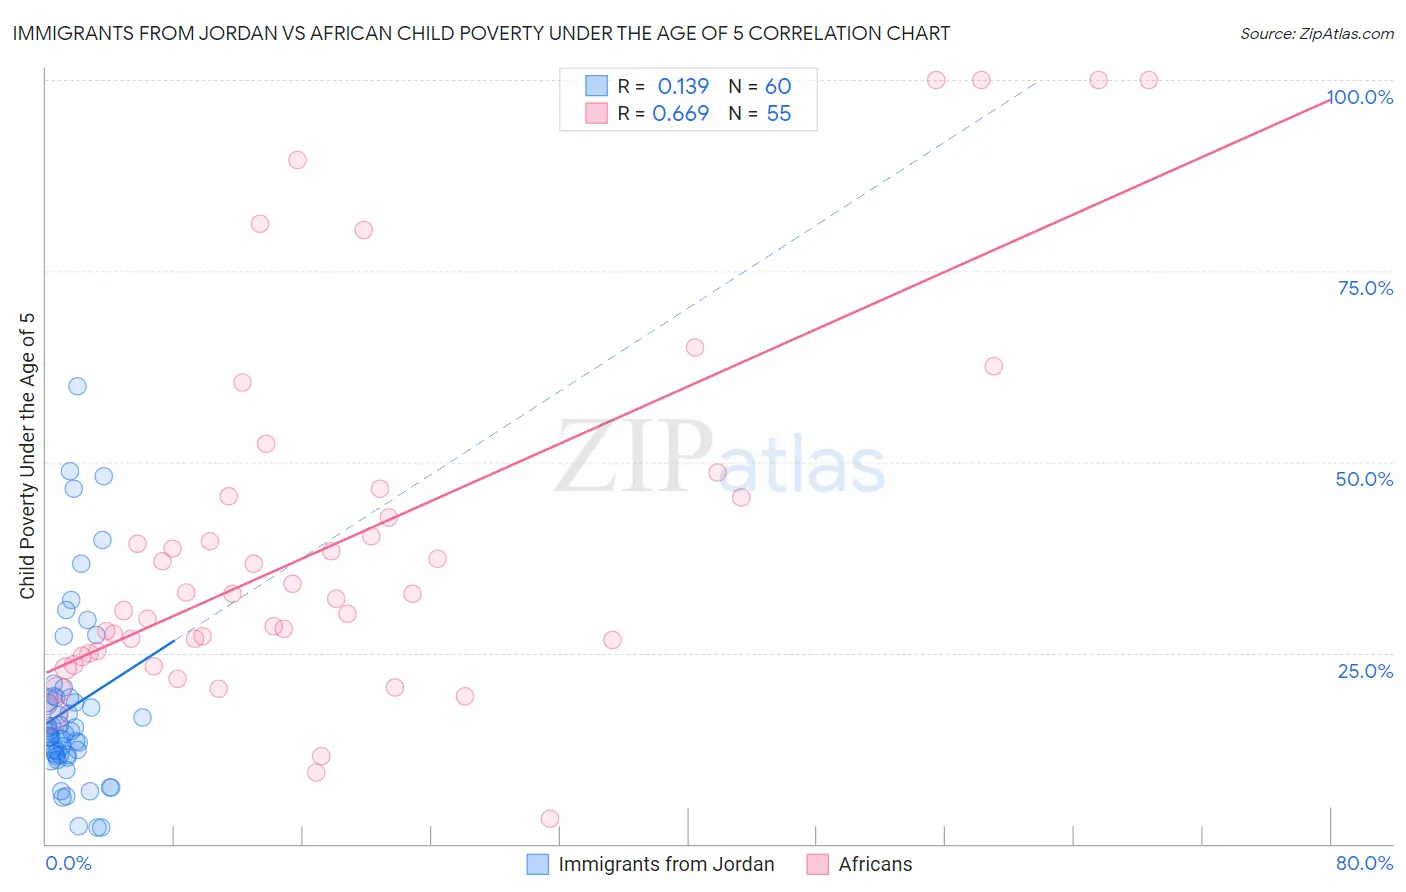
Immigrants from Jordan vs African Child Poverty Under the Age of 5 Correlation Chart
The statistical analysis conducted on geographies consisting of 178,163,363 people shows a poor positive correlation between the proportion of Immigrants from Jordan and poverty level among children under the age of 5 in the United States with a correlation coefficient (R) of 0.139 and weighted average of 16.1%. Similarly, the statistical analysis conducted on geographies consisting of 453,839,737 people shows a significant positive correlation between the proportion of Africans and poverty level among children under the age of 5 in the United States with a correlation coefficient (R) of 0.669 and weighted average of 22.8%, a difference of 42.0%.
Child Poverty Under the Age of 5 Correlation Summary
| Measurement | Immigrants from Jordan | African |
| Minimum | 2.1% | 3.3% |
| Maximum | 59.8% | 100.0% |
| Range | 57.7% | 96.7% |
| Mean | 17.7% | 39.8% |
| Median | 14.5% | 32.7% |
| Interquartile 25% (IQ1) | 11.6% | 24.9% |
| Interquartile 75% (IQ3) | 19.2% | 45.5% |
| Interquartile Range (IQR) | 7.6% | 20.6% |
| Standard Deviation (Sample) | 11.8% | 24.0% |
| Standard Deviation (Population) | 11.7% | 23.7% |
Similar Demographics by Child Poverty Under the Age of 5
Demographics Similar to Immigrants from Jordan by Child Poverty Under the Age of 5
In terms of child poverty under the age of 5, the demographic groups most similar to Immigrants from Jordan are Basque (16.0%, a difference of 0.11%), Immigrants from Denmark (16.0%, a difference of 0.11%), Immigrants from Austria (16.0%, a difference of 0.13%), Immigrants from Peru (16.1%, a difference of 0.26%), and Mongolian (16.1%, a difference of 0.27%).
| Demographics | Rating | Rank | Child Poverty Under the Age of 5 |
| Peruvians | 94.1 /100 | #112 | Exceptional 16.0% |
| Puget Sound Salish | 94.1 /100 | #113 | Exceptional 16.0% |
| Immigrants | Kuwait | 93.9 /100 | #114 | Exceptional 16.0% |
| Albanians | 93.8 /100 | #115 | Exceptional 16.0% |
| Immigrants | Austria | 93.5 /100 | #116 | Exceptional 16.0% |
| Basques | 93.4 /100 | #117 | Exceptional 16.0% |
| Immigrants | Denmark | 93.4 /100 | #118 | Exceptional 16.0% |
| Immigrants | Jordan | 93.2 /100 | #119 | Exceptional 16.1% |
| Immigrants | Peru | 92.6 /100 | #120 | Exceptional 16.1% |
| Mongolians | 92.5 /100 | #121 | Exceptional 16.1% |
| Immigrants | Southern Europe | 92.0 /100 | #122 | Exceptional 16.1% |
| Austrians | 92.0 /100 | #123 | Exceptional 16.1% |
| Swiss | 92.0 /100 | #124 | Exceptional 16.1% |
| Native Hawaiians | 91.8 /100 | #125 | Exceptional 16.2% |
| Immigrants | Albania | 91.8 /100 | #126 | Exceptional 16.2% |
Demographics Similar to Africans by Child Poverty Under the Age of 5
In terms of child poverty under the age of 5, the demographic groups most similar to Africans are Seminole (22.8%, a difference of 0.050%), Houma (22.7%, a difference of 0.41%), Immigrants from Dominica (22.7%, a difference of 0.55%), Immigrants from Bahamas (22.7%, a difference of 0.59%), and Honduran (23.0%, a difference of 0.64%).
| Demographics | Rating | Rank | Child Poverty Under the Age of 5 |
| Inupiat | 0.0 /100 | #303 | Tragic 22.0% |
| Immigrants | Guatemala | 0.0 /100 | #304 | Tragic 22.0% |
| Immigrants | Mexico | 0.0 /100 | #305 | Tragic 22.2% |
| Indonesians | 0.0 /100 | #306 | Tragic 22.3% |
| Immigrants | Bahamas | 0.0 /100 | #307 | Tragic 22.7% |
| Immigrants | Dominica | 0.0 /100 | #308 | Tragic 22.7% |
| Houma | 0.0 /100 | #309 | Tragic 22.7% |
| Africans | 0.0 /100 | #310 | Tragic 22.8% |
| Seminole | 0.0 /100 | #311 | Tragic 22.8% |
| Hondurans | 0.0 /100 | #312 | Tragic 23.0% |
| Bahamians | 0.0 /100 | #313 | Tragic 23.0% |
| U.S. Virgin Islanders | 0.0 /100 | #314 | Tragic 23.0% |
| Arapaho | 0.0 /100 | #315 | Tragic 23.1% |
| Yakama | 0.0 /100 | #316 | Tragic 23.1% |
| Menominee | 0.0 /100 | #317 | Tragic 23.3% |