Immigrants from North Macedonia vs African Child Poverty Under the Age of 5
COMPARE
Immigrants from North Macedonia
African
Child Poverty Under the Age of 5
Child Poverty Under the Age of 5 Comparison
Immigrants from North Macedonia
Africans
16.4%
CHILD POVERTY UNDER THE AGE OF 5
87.8/ 100
METRIC RATING
134th/ 347
METRIC RANK
22.8%
CHILD POVERTY UNDER THE AGE OF 5
0.0/ 100
METRIC RATING
310th/ 347
METRIC RANK
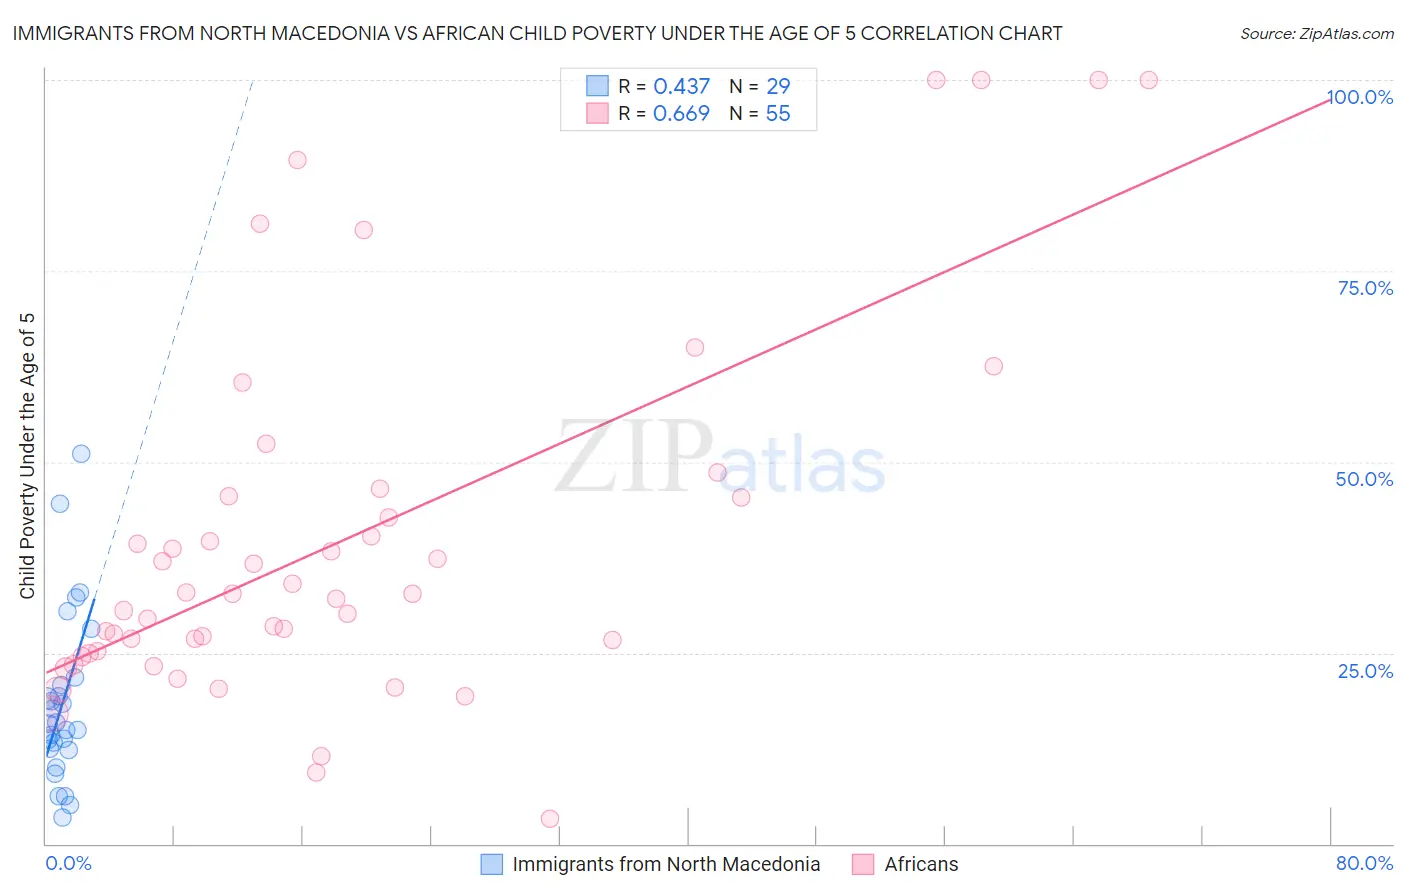
Immigrants from North Macedonia vs African Child Poverty Under the Age of 5 Correlation Chart
The statistical analysis conducted on geographies consisting of 72,663,175 people shows a moderate positive correlation between the proportion of Immigrants from North Macedonia and poverty level among children under the age of 5 in the United States with a correlation coefficient (R) of 0.437 and weighted average of 16.4%. Similarly, the statistical analysis conducted on geographies consisting of 453,839,737 people shows a significant positive correlation between the proportion of Africans and poverty level among children under the age of 5 in the United States with a correlation coefficient (R) of 0.669 and weighted average of 22.8%, a difference of 39.5%.
Child Poverty Under the Age of 5 Correlation Summary
| Measurement | Immigrants from North Macedonia | African |
| Minimum | 3.4% | 3.3% |
| Maximum | 51.0% | 100.0% |
| Range | 47.6% | 96.7% |
| Mean | 18.5% | 39.8% |
| Median | 15.8% | 32.7% |
| Interquartile 25% (IQ1) | 12.3% | 24.9% |
| Interquartile 75% (IQ3) | 21.3% | 45.5% |
| Interquartile Range (IQR) | 9.0% | 20.6% |
| Standard Deviation (Sample) | 11.1% | 24.0% |
| Standard Deviation (Population) | 10.9% | 23.7% |
Similar Demographics by Child Poverty Under the Age of 5
Demographics Similar to Immigrants from North Macedonia by Child Poverty Under the Age of 5
In terms of child poverty under the age of 5, the demographic groups most similar to Immigrants from North Macedonia are Brazilian (16.4%, a difference of 0.010%), Icelander (16.3%, a difference of 0.020%), Immigrants from Northern Africa (16.4%, a difference of 0.070%), Serbian (16.3%, a difference of 0.090%), and Finnish (16.3%, a difference of 0.12%).
| Demographics | Rating | Rank | Child Poverty Under the Age of 5 |
| Immigrants | England | 91.5 /100 | #127 | Exceptional 16.2% |
| South Africans | 90.1 /100 | #128 | Exceptional 16.2% |
| British | 89.4 /100 | #129 | Excellent 16.3% |
| Immigrants | Norway | 89.3 /100 | #130 | Excellent 16.3% |
| Finns | 88.3 /100 | #131 | Excellent 16.3% |
| Serbians | 88.2 /100 | #132 | Excellent 16.3% |
| Icelanders | 87.9 /100 | #133 | Excellent 16.3% |
| Immigrants | North Macedonia | 87.8 /100 | #134 | Excellent 16.4% |
| Brazilians | 87.8 /100 | #135 | Excellent 16.4% |
| Immigrants | Northern Africa | 87.5 /100 | #136 | Excellent 16.4% |
| Immigrants | Chile | 85.3 /100 | #137 | Excellent 16.4% |
| Germans | 84.8 /100 | #138 | Excellent 16.5% |
| Immigrants | Hungary | 84.5 /100 | #139 | Excellent 16.5% |
| Guamanians/Chamorros | 84.2 /100 | #140 | Excellent 16.5% |
| Immigrants | Western Europe | 83.3 /100 | #141 | Excellent 16.5% |
Demographics Similar to Africans by Child Poverty Under the Age of 5
In terms of child poverty under the age of 5, the demographic groups most similar to Africans are Seminole (22.8%, a difference of 0.050%), Houma (22.7%, a difference of 0.41%), Immigrants from Dominica (22.7%, a difference of 0.55%), Immigrants from Bahamas (22.7%, a difference of 0.59%), and Honduran (23.0%, a difference of 0.64%).
| Demographics | Rating | Rank | Child Poverty Under the Age of 5 |
| Inupiat | 0.0 /100 | #303 | Tragic 22.0% |
| Immigrants | Guatemala | 0.0 /100 | #304 | Tragic 22.0% |
| Immigrants | Mexico | 0.0 /100 | #305 | Tragic 22.2% |
| Indonesians | 0.0 /100 | #306 | Tragic 22.3% |
| Immigrants | Bahamas | 0.0 /100 | #307 | Tragic 22.7% |
| Immigrants | Dominica | 0.0 /100 | #308 | Tragic 22.7% |
| Houma | 0.0 /100 | #309 | Tragic 22.7% |
| Africans | 0.0 /100 | #310 | Tragic 22.8% |
| Seminole | 0.0 /100 | #311 | Tragic 22.8% |
| Hondurans | 0.0 /100 | #312 | Tragic 23.0% |
| Bahamians | 0.0 /100 | #313 | Tragic 23.0% |
| U.S. Virgin Islanders | 0.0 /100 | #314 | Tragic 23.0% |
| Arapaho | 0.0 /100 | #315 | Tragic 23.1% |
| Yakama | 0.0 /100 | #316 | Tragic 23.1% |
| Menominee | 0.0 /100 | #317 | Tragic 23.3% |