Thai vs Belgian Female Poverty Among 18-24 Year Olds
COMPARE
Thai
Belgian
Female Poverty Among 18-24 Year Olds
Female Poverty Among 18-24 Year Olds Comparison
Thais
Belgians
17.0%
FEMALE POVERTY AMONG 18-24 YEAR OLDS
100.0/ 100
METRIC RATING
11th/ 347
METRIC RANK
19.9%
FEMALE POVERTY AMONG 18-24 YEAR OLDS
69.1/ 100
METRIC RATING
166th/ 347
METRIC RANK
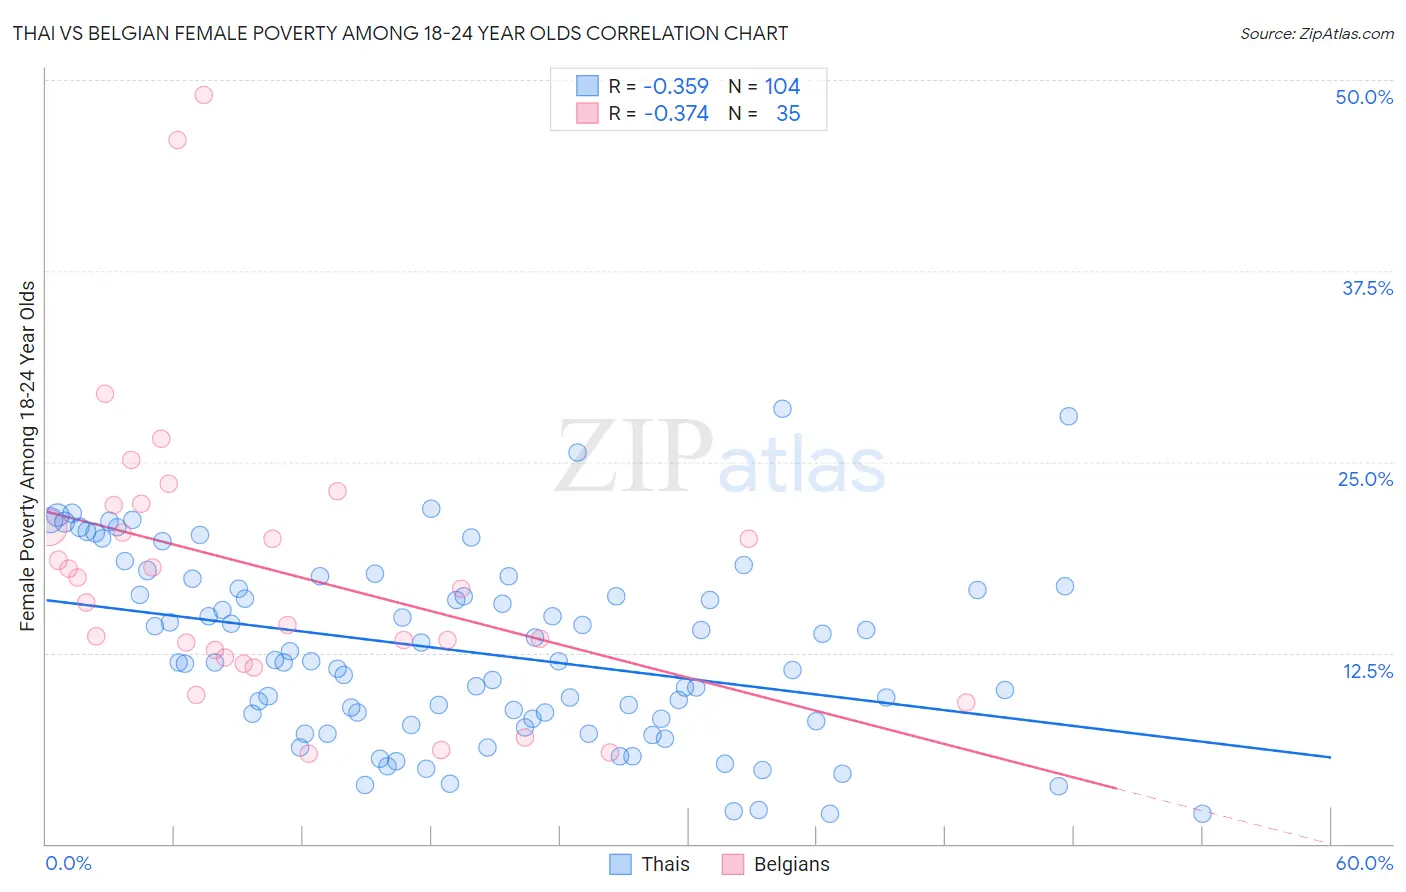
Thai vs Belgian Female Poverty Among 18-24 Year Olds Correlation Chart
The statistical analysis conducted on geographies consisting of 460,499,856 people shows a mild negative correlation between the proportion of Thais and poverty level among females between the ages 18 and 24 in the United States with a correlation coefficient (R) of -0.359 and weighted average of 17.0%. Similarly, the statistical analysis conducted on geographies consisting of 345,924,270 people shows a mild negative correlation between the proportion of Belgians and poverty level among females between the ages 18 and 24 in the United States with a correlation coefficient (R) of -0.374 and weighted average of 19.9%, a difference of 17.2%.
Female Poverty Among 18-24 Year Olds Correlation Summary
| Measurement | Thai | Belgian |
| Minimum | 1.9% | 5.9% |
| Maximum | 28.4% | 49.0% |
| Range | 26.5% | 43.1% |
| Mean | 12.6% | 17.9% |
| Median | 11.9% | 16.7% |
| Interquartile 25% (IQ1) | 8.1% | 12.2% |
| Interquartile 75% (IQ3) | 16.8% | 22.2% |
| Interquartile Range (IQR) | 8.7% | 10.0% |
| Standard Deviation (Sample) | 6.0% | 9.5% |
| Standard Deviation (Population) | 6.0% | 9.4% |
Similar Demographics by Female Poverty Among 18-24 Year Olds
Demographics Similar to Thais by Female Poverty Among 18-24 Year Olds
In terms of female poverty among 18-24 year olds, the demographic groups most similar to Thais are Immigrants from Pakistan (17.0%, a difference of 0.090%), Korean (16.9%, a difference of 0.27%), Immigrants from Peru (16.9%, a difference of 0.63%), Immigrants from Poland (17.1%, a difference of 0.75%), and Tongan (17.1%, a difference of 0.93%).
| Demographics | Rating | Rank | Female Poverty Among 18-24 Year Olds |
| Immigrants | India | 100.0 /100 | #4 | Exceptional 16.4% |
| Immigrants | Portugal | 100.0 /100 | #5 | Exceptional 16.5% |
| Immigrants | Philippines | 100.0 /100 | #6 | Exceptional 16.7% |
| Immigrants | Azores | 100.0 /100 | #7 | Exceptional 16.7% |
| Immigrants | Bolivia | 100.0 /100 | #8 | Exceptional 16.7% |
| Immigrants | Peru | 100.0 /100 | #9 | Exceptional 16.9% |
| Koreans | 100.0 /100 | #10 | Exceptional 16.9% |
| Thais | 100.0 /100 | #11 | Exceptional 17.0% |
| Immigrants | Pakistan | 100.0 /100 | #12 | Exceptional 17.0% |
| Immigrants | Poland | 100.0 /100 | #13 | Exceptional 17.1% |
| Tongans | 100.0 /100 | #14 | Exceptional 17.1% |
| Cubans | 100.0 /100 | #15 | Exceptional 17.2% |
| Peruvians | 100.0 /100 | #16 | Exceptional 17.2% |
| Immigrants | Taiwan | 100.0 /100 | #17 | Exceptional 17.3% |
| Immigrants | Colombia | 100.0 /100 | #18 | Exceptional 17.3% |
Demographics Similar to Belgians by Female Poverty Among 18-24 Year Olds
In terms of female poverty among 18-24 year olds, the demographic groups most similar to Belgians are Eastern European (19.9%, a difference of 0.010%), Central American (19.9%, a difference of 0.050%), Malaysian (19.9%, a difference of 0.21%), French Canadian (19.9%, a difference of 0.24%), and Immigrants from Belize (19.8%, a difference of 0.30%).
| Demographics | Rating | Rank | Female Poverty Among 18-24 Year Olds |
| Trinidadians and Tobagonians | 74.4 /100 | #159 | Good 19.8% |
| Pakistanis | 74.1 /100 | #160 | Good 19.8% |
| Immigrants | Belize | 74.1 /100 | #161 | Good 19.8% |
| French Canadians | 73.0 /100 | #162 | Good 19.9% |
| Malaysians | 72.7 /100 | #163 | Good 19.9% |
| Central Americans | 70.0 /100 | #164 | Good 19.9% |
| Eastern Europeans | 69.3 /100 | #165 | Good 19.9% |
| Belgians | 69.1 /100 | #166 | Good 19.9% |
| Czechoslovakians | 61.8 /100 | #167 | Good 20.0% |
| Fijians | 59.1 /100 | #168 | Average 20.0% |
| Hmong | 55.4 /100 | #169 | Average 20.0% |
| Iranians | 54.7 /100 | #170 | Average 20.1% |
| Immigrants | Nigeria | 54.3 /100 | #171 | Average 20.1% |
| Belizeans | 52.0 /100 | #172 | Average 20.1% |
| Irish | 50.0 /100 | #173 | Average 20.1% |