Thai vs Ute Female Poverty Among 18-24 Year Olds
COMPARE
Thai
Ute
Female Poverty Among 18-24 Year Olds
Female Poverty Among 18-24 Year Olds Comparison
Thais
Ute
17.0%
FEMALE POVERTY AMONG 18-24 YEAR OLDS
100.0/ 100
METRIC RATING
11th/ 347
METRIC RANK
25.4%
FEMALE POVERTY AMONG 18-24 YEAR OLDS
0.0/ 100
METRIC RATING
327th/ 347
METRIC RANK
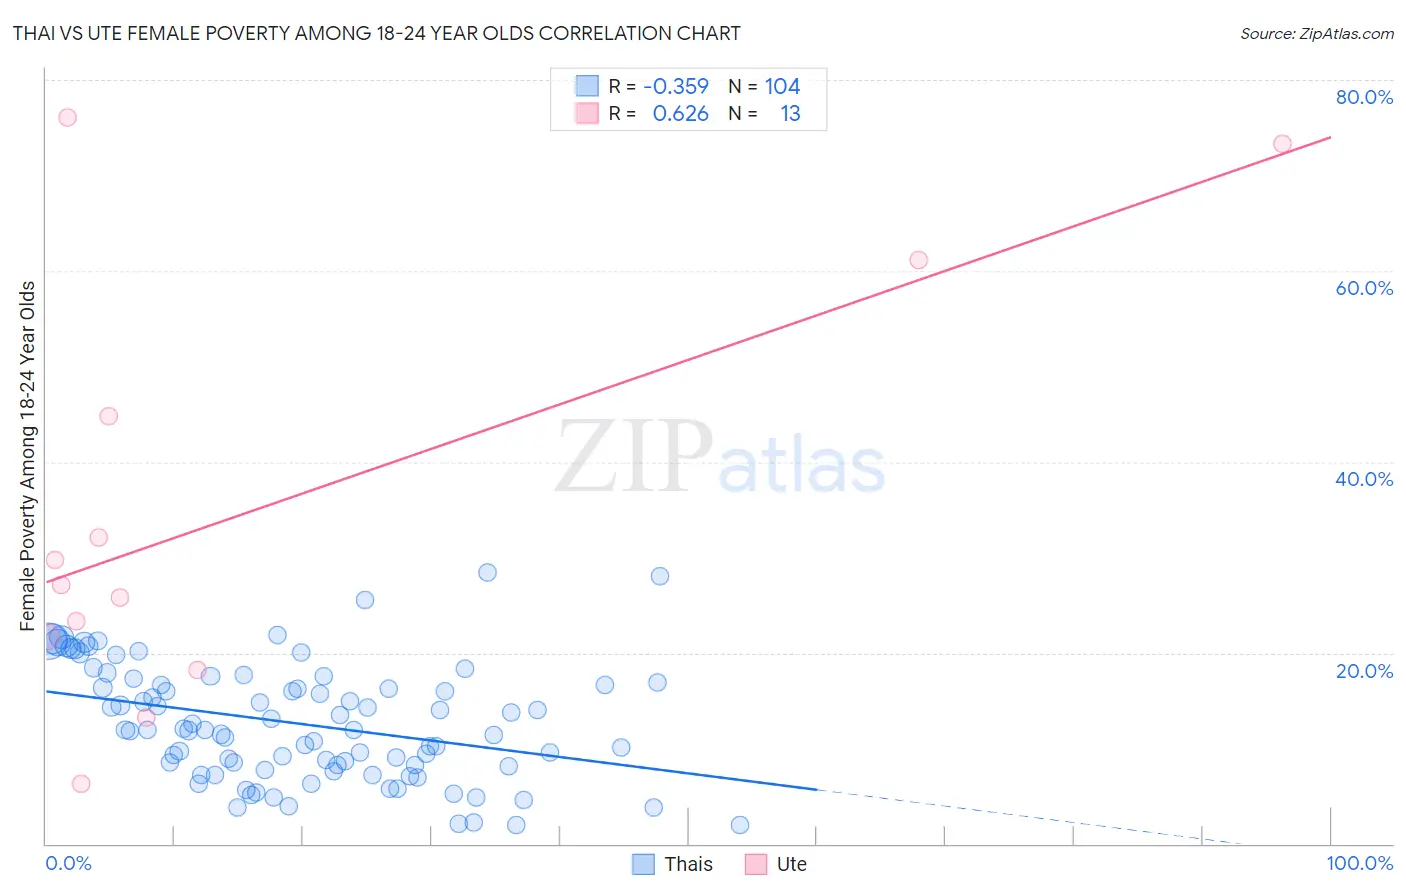
Thai vs Ute Female Poverty Among 18-24 Year Olds Correlation Chart
The statistical analysis conducted on geographies consisting of 460,499,856 people shows a mild negative correlation between the proportion of Thais and poverty level among females between the ages 18 and 24 in the United States with a correlation coefficient (R) of -0.359 and weighted average of 17.0%. Similarly, the statistical analysis conducted on geographies consisting of 55,446,169 people shows a significant positive correlation between the proportion of Ute and poverty level among females between the ages 18 and 24 in the United States with a correlation coefficient (R) of 0.626 and weighted average of 25.4%, a difference of 49.6%.
Female Poverty Among 18-24 Year Olds Correlation Summary
| Measurement | Thai | Ute |
| Minimum | 1.9% | 6.2% |
| Maximum | 28.4% | 76.1% |
| Range | 26.5% | 69.9% |
| Mean | 12.6% | 34.8% |
| Median | 11.9% | 27.1% |
| Interquartile 25% (IQ1) | 8.1% | 19.9% |
| Interquartile 75% (IQ3) | 16.8% | 52.9% |
| Interquartile Range (IQR) | 8.7% | 33.0% |
| Standard Deviation (Sample) | 6.0% | 22.4% |
| Standard Deviation (Population) | 6.0% | 21.5% |
Similar Demographics by Female Poverty Among 18-24 Year Olds
Demographics Similar to Thais by Female Poverty Among 18-24 Year Olds
In terms of female poverty among 18-24 year olds, the demographic groups most similar to Thais are Immigrants from Pakistan (17.0%, a difference of 0.090%), Korean (16.9%, a difference of 0.27%), Immigrants from Peru (16.9%, a difference of 0.63%), Immigrants from Poland (17.1%, a difference of 0.75%), and Tongan (17.1%, a difference of 0.93%).
| Demographics | Rating | Rank | Female Poverty Among 18-24 Year Olds |
| Immigrants | India | 100.0 /100 | #4 | Exceptional 16.4% |
| Immigrants | Portugal | 100.0 /100 | #5 | Exceptional 16.5% |
| Immigrants | Philippines | 100.0 /100 | #6 | Exceptional 16.7% |
| Immigrants | Azores | 100.0 /100 | #7 | Exceptional 16.7% |
| Immigrants | Bolivia | 100.0 /100 | #8 | Exceptional 16.7% |
| Immigrants | Peru | 100.0 /100 | #9 | Exceptional 16.9% |
| Koreans | 100.0 /100 | #10 | Exceptional 16.9% |
| Thais | 100.0 /100 | #11 | Exceptional 17.0% |
| Immigrants | Pakistan | 100.0 /100 | #12 | Exceptional 17.0% |
| Immigrants | Poland | 100.0 /100 | #13 | Exceptional 17.1% |
| Tongans | 100.0 /100 | #14 | Exceptional 17.1% |
| Cubans | 100.0 /100 | #15 | Exceptional 17.2% |
| Peruvians | 100.0 /100 | #16 | Exceptional 17.2% |
| Immigrants | Taiwan | 100.0 /100 | #17 | Exceptional 17.3% |
| Immigrants | Colombia | 100.0 /100 | #18 | Exceptional 17.3% |
Demographics Similar to Ute by Female Poverty Among 18-24 Year Olds
In terms of female poverty among 18-24 year olds, the demographic groups most similar to Ute are Native/Alaskan (25.4%, a difference of 0.050%), Yakama (25.3%, a difference of 0.23%), Immigrants from Saudi Arabia (25.3%, a difference of 0.48%), German Russian (25.2%, a difference of 0.91%), and Arapaho (25.2%, a difference of 0.94%).
| Demographics | Rating | Rank | Female Poverty Among 18-24 Year Olds |
| Immigrants | Congo | 0.0 /100 | #320 | Tragic 24.6% |
| Immigrants | Zaire | 0.0 /100 | #321 | Tragic 25.1% |
| Somalis | 0.0 /100 | #322 | Tragic 25.1% |
| Arapaho | 0.0 /100 | #323 | Tragic 25.2% |
| German Russians | 0.0 /100 | #324 | Tragic 25.2% |
| Immigrants | Saudi Arabia | 0.0 /100 | #325 | Tragic 25.3% |
| Yakama | 0.0 /100 | #326 | Tragic 25.3% |
| Ute | 0.0 /100 | #327 | Tragic 25.4% |
| Natives/Alaskans | 0.0 /100 | #328 | Tragic 25.4% |
| Cajuns | 0.0 /100 | #329 | Tragic 25.7% |
| Immigrants | Somalia | 0.0 /100 | #330 | Tragic 25.7% |
| Chippewa | 0.0 /100 | #331 | Tragic 25.9% |
| Houma | 0.0 /100 | #332 | Tragic 26.2% |
| Apache | 0.0 /100 | #333 | Tragic 26.3% |
| Pueblo | 0.0 /100 | #334 | Tragic 26.9% |