Immigrants from Congo vs Belgian Female Poverty Among 18-24 Year Olds
COMPARE
Immigrants from Congo
Belgian
Female Poverty Among 18-24 Year Olds
Female Poverty Among 18-24 Year Olds Comparison
Immigrants from Congo
Belgians
24.6%
FEMALE POVERTY AMONG 18-24 YEAR OLDS
0.0/ 100
METRIC RATING
320th/ 347
METRIC RANK
19.9%
FEMALE POVERTY AMONG 18-24 YEAR OLDS
69.1/ 100
METRIC RATING
166th/ 347
METRIC RANK
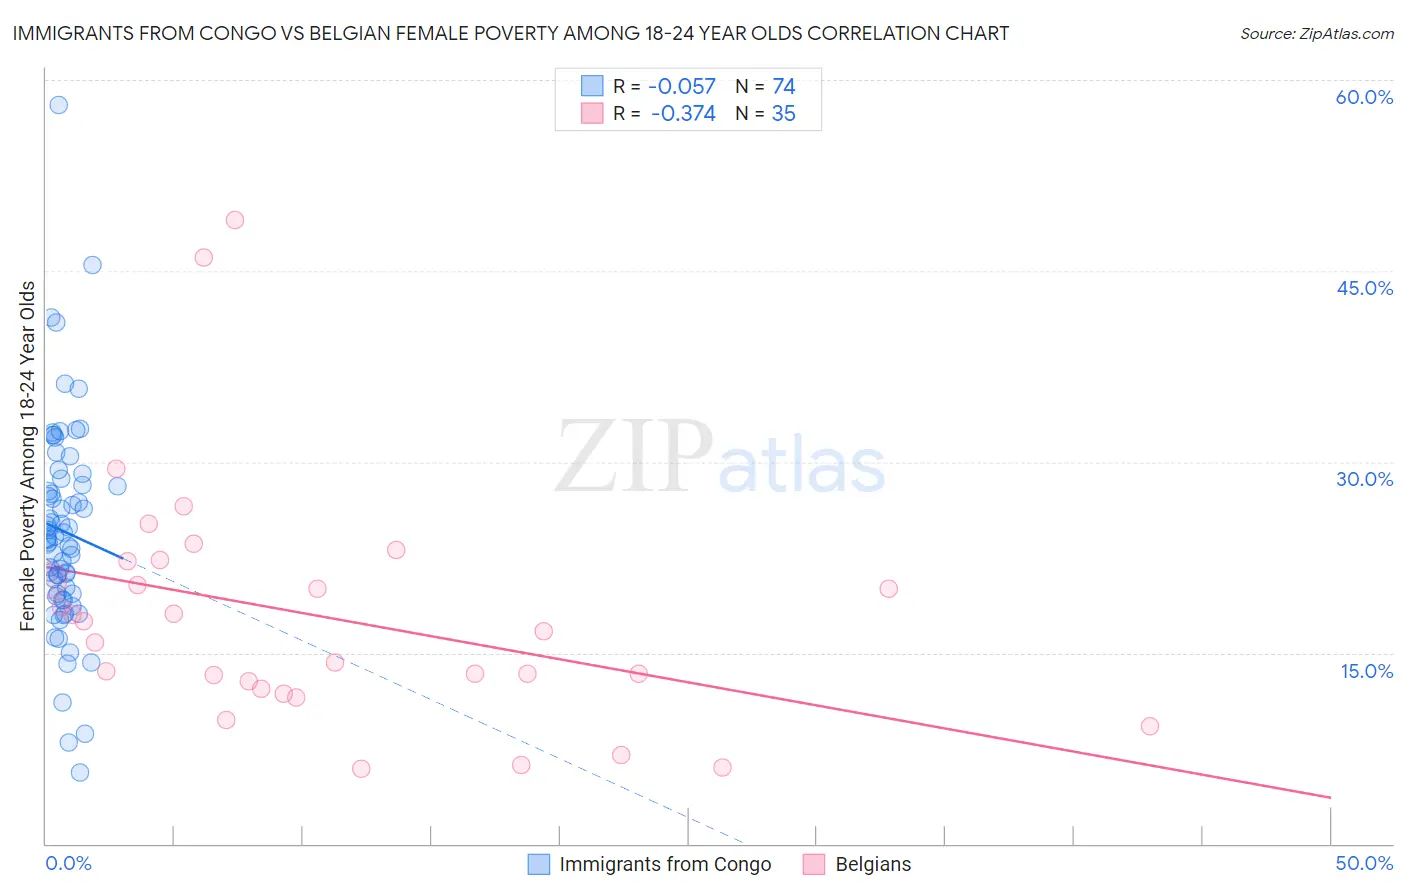
Immigrants from Congo vs Belgian Female Poverty Among 18-24 Year Olds Correlation Chart
The statistical analysis conducted on geographies consisting of 91,799,806 people shows a slight negative correlation between the proportion of Immigrants from Congo and poverty level among females between the ages 18 and 24 in the United States with a correlation coefficient (R) of -0.057 and weighted average of 24.6%. Similarly, the statistical analysis conducted on geographies consisting of 345,924,270 people shows a mild negative correlation between the proportion of Belgians and poverty level among females between the ages 18 and 24 in the United States with a correlation coefficient (R) of -0.374 and weighted average of 19.9%, a difference of 23.5%.
Female Poverty Among 18-24 Year Olds Correlation Summary
| Measurement | Immigrants from Congo | Belgian |
| Minimum | 5.6% | 5.9% |
| Maximum | 58.1% | 49.0% |
| Range | 52.5% | 43.1% |
| Mean | 24.6% | 17.9% |
| Median | 24.0% | 16.7% |
| Interquartile 25% (IQ1) | 19.6% | 12.2% |
| Interquartile 75% (IQ3) | 28.2% | 22.2% |
| Interquartile Range (IQR) | 8.6% | 10.0% |
| Standard Deviation (Sample) | 8.3% | 9.5% |
| Standard Deviation (Population) | 8.2% | 9.4% |
Similar Demographics by Female Poverty Among 18-24 Year Olds
Demographics Similar to Immigrants from Congo by Female Poverty Among 18-24 Year Olds
In terms of female poverty among 18-24 year olds, the demographic groups most similar to Immigrants from Congo are Dutch West Indian (24.5%, a difference of 0.30%), Chickasaw (24.5%, a difference of 0.40%), Osage (24.5%, a difference of 0.48%), Alsatian (24.4%, a difference of 0.78%), and Black/African American (24.3%, a difference of 1.1%).
| Demographics | Rating | Rank | Female Poverty Among 18-24 Year Olds |
| Creek | 0.0 /100 | #313 | Tragic 24.2% |
| Choctaw | 0.0 /100 | #314 | Tragic 24.3% |
| Blacks/African Americans | 0.0 /100 | #315 | Tragic 24.3% |
| Alsatians | 0.0 /100 | #316 | Tragic 24.4% |
| Osage | 0.0 /100 | #317 | Tragic 24.5% |
| Chickasaw | 0.0 /100 | #318 | Tragic 24.5% |
| Dutch West Indians | 0.0 /100 | #319 | Tragic 24.5% |
| Immigrants | Congo | 0.0 /100 | #320 | Tragic 24.6% |
| Immigrants | Zaire | 0.0 /100 | #321 | Tragic 25.1% |
| Somalis | 0.0 /100 | #322 | Tragic 25.1% |
| Arapaho | 0.0 /100 | #323 | Tragic 25.2% |
| German Russians | 0.0 /100 | #324 | Tragic 25.2% |
| Immigrants | Saudi Arabia | 0.0 /100 | #325 | Tragic 25.3% |
| Yakama | 0.0 /100 | #326 | Tragic 25.3% |
| Ute | 0.0 /100 | #327 | Tragic 25.4% |
Demographics Similar to Belgians by Female Poverty Among 18-24 Year Olds
In terms of female poverty among 18-24 year olds, the demographic groups most similar to Belgians are Eastern European (19.9%, a difference of 0.010%), Central American (19.9%, a difference of 0.050%), Malaysian (19.9%, a difference of 0.21%), French Canadian (19.9%, a difference of 0.24%), and Immigrants from Belize (19.8%, a difference of 0.30%).
| Demographics | Rating | Rank | Female Poverty Among 18-24 Year Olds |
| Trinidadians and Tobagonians | 74.4 /100 | #159 | Good 19.8% |
| Pakistanis | 74.1 /100 | #160 | Good 19.8% |
| Immigrants | Belize | 74.1 /100 | #161 | Good 19.8% |
| French Canadians | 73.0 /100 | #162 | Good 19.9% |
| Malaysians | 72.7 /100 | #163 | Good 19.9% |
| Central Americans | 70.0 /100 | #164 | Good 19.9% |
| Eastern Europeans | 69.3 /100 | #165 | Good 19.9% |
| Belgians | 69.1 /100 | #166 | Good 19.9% |
| Czechoslovakians | 61.8 /100 | #167 | Good 20.0% |
| Fijians | 59.1 /100 | #168 | Average 20.0% |
| Hmong | 55.4 /100 | #169 | Average 20.0% |
| Iranians | 54.7 /100 | #170 | Average 20.1% |
| Immigrants | Nigeria | 54.3 /100 | #171 | Average 20.1% |
| Belizeans | 52.0 /100 | #172 | Average 20.1% |
| Irish | 50.0 /100 | #173 | Average 20.1% |