Taiwanese vs Immigrants from Guyana Seniors Poverty Over the Age of 65
COMPARE
Taiwanese
Immigrants from Guyana
Seniors Poverty Over the Age of 65
Seniors Poverty Over the Age of 65 Comparison
Taiwanese
Immigrants from Guyana
11.2%
SENIORS POVERTY OVER THE AGE OF 65
29.2/ 100
METRIC RATING
193rd/ 347
METRIC RANK
14.5%
SENIORS POVERTY OVER THE AGE OF 65
0.0/ 100
METRIC RATING
316th/ 347
METRIC RANK
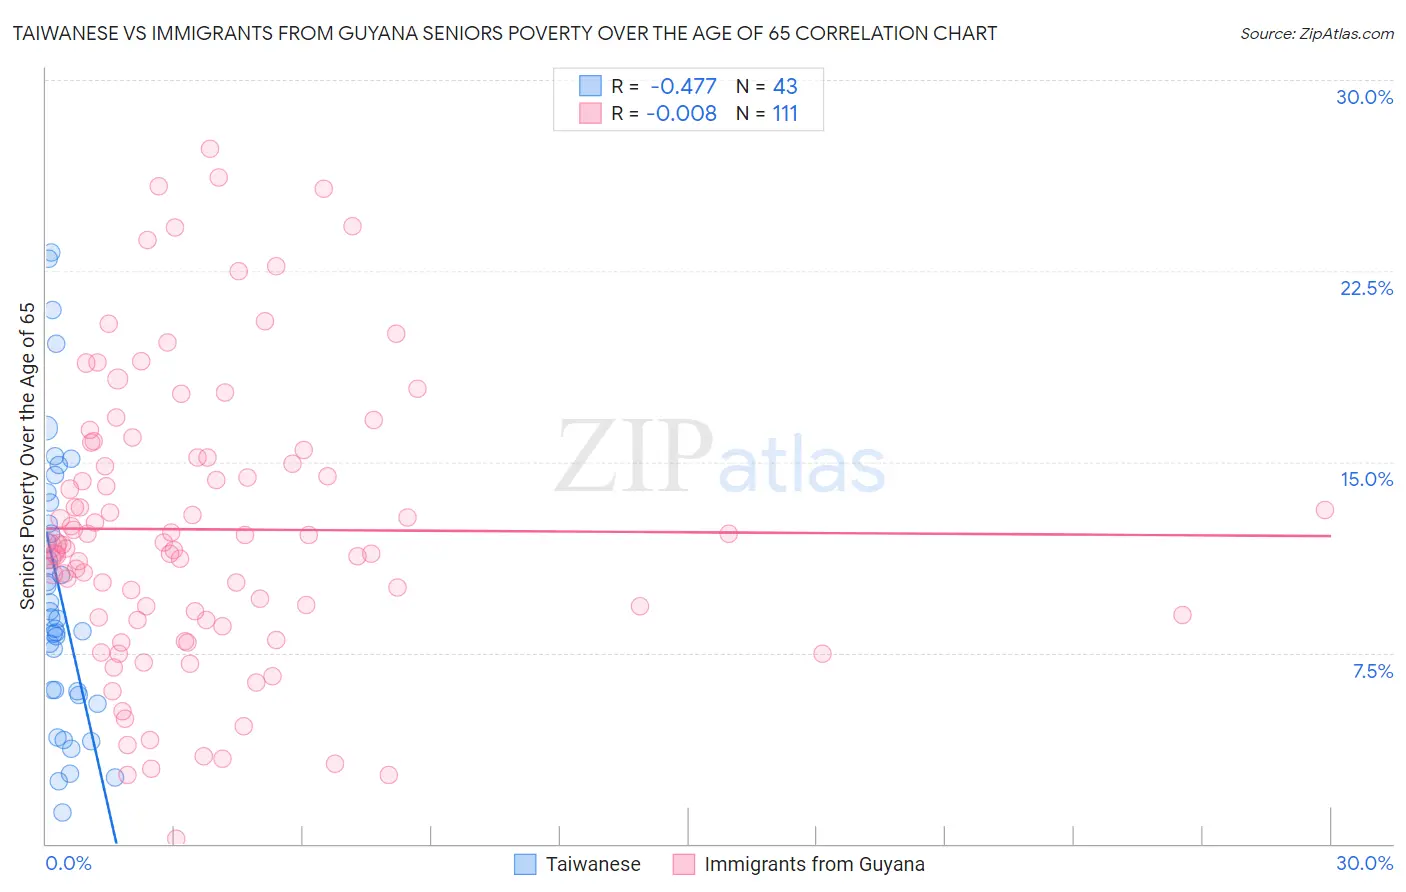
Taiwanese vs Immigrants from Guyana Seniors Poverty Over the Age of 65 Correlation Chart
The statistical analysis conducted on geographies consisting of 31,675,207 people shows a moderate negative correlation between the proportion of Taiwanese and poverty level among seniors over the age of 65 in the United States with a correlation coefficient (R) of -0.477 and weighted average of 11.2%. Similarly, the statistical analysis conducted on geographies consisting of 183,396,619 people shows no correlation between the proportion of Immigrants from Guyana and poverty level among seniors over the age of 65 in the United States with a correlation coefficient (R) of -0.008 and weighted average of 14.5%, a difference of 29.7%.
Seniors Poverty Over the Age of 65 Correlation Summary
| Measurement | Taiwanese | Immigrants from Guyana |
| Minimum | 1.2% | 0.21% |
| Maximum | 23.2% | 27.3% |
| Range | 22.0% | 27.1% |
| Mean | 9.9% | 12.3% |
| Median | 8.9% | 11.7% |
| Interquartile 25% (IQ1) | 6.0% | 8.8% |
| Interquartile 75% (IQ3) | 13.4% | 15.2% |
| Interquartile Range (IQR) | 7.4% | 6.4% |
| Standard Deviation (Sample) | 5.4% | 5.7% |
| Standard Deviation (Population) | 5.4% | 5.6% |
Similar Demographics by Seniors Poverty Over the Age of 65
Demographics Similar to Taiwanese by Seniors Poverty Over the Age of 65
In terms of seniors poverty over the age of 65, the demographic groups most similar to Taiwanese are Immigrants from Southern Europe (11.1%, a difference of 0.090%), Chilean (11.2%, a difference of 0.15%), Immigrants from Vietnam (11.2%, a difference of 0.29%), Immigrants from Uganda (11.1%, a difference of 0.30%), and Bangladeshi (11.2%, a difference of 0.45%).
| Demographics | Rating | Rank | Seniors Poverty Over the Age of 65 |
| Immigrants | Eastern Asia | 37.5 /100 | #186 | Fair 11.1% |
| Immigrants | Middle Africa | 37.4 /100 | #187 | Fair 11.1% |
| Immigrants | Hong Kong | 36.3 /100 | #188 | Fair 11.1% |
| Immigrants | Laos | 35.7 /100 | #189 | Fair 11.1% |
| Indians (Asian) | 34.2 /100 | #190 | Fair 11.1% |
| Immigrants | Uganda | 32.2 /100 | #191 | Fair 11.1% |
| Immigrants | Southern Europe | 30.1 /100 | #192 | Fair 11.1% |
| Taiwanese | 29.2 /100 | #193 | Fair 11.2% |
| Chileans | 27.8 /100 | #194 | Fair 11.2% |
| Immigrants | Vietnam | 26.6 /100 | #195 | Fair 11.2% |
| Bangladeshis | 25.2 /100 | #196 | Fair 11.2% |
| Albanians | 24.4 /100 | #197 | Fair 11.2% |
| Immigrants | Burma/Myanmar | 21.3 /100 | #198 | Fair 11.3% |
| Immigrants | Israel | 20.3 /100 | #199 | Fair 11.3% |
| Alsatians | 20.1 /100 | #200 | Fair 11.3% |
Demographics Similar to Immigrants from Guyana by Seniors Poverty Over the Age of 65
In terms of seniors poverty over the age of 65, the demographic groups most similar to Immigrants from Guyana are Haitian (14.5%, a difference of 0.030%), Immigrants from Ecuador (14.4%, a difference of 0.21%), Guyanese (14.4%, a difference of 0.24%), Immigrants from Honduras (14.5%, a difference of 0.24%), and Barbadian (14.4%, a difference of 0.64%).
| Demographics | Rating | Rank | Seniors Poverty Over the Age of 65 |
| Hondurans | 0.0 /100 | #309 | Tragic 14.2% |
| Bahamians | 0.0 /100 | #310 | Tragic 14.2% |
| Natives/Alaskans | 0.0 /100 | #311 | Tragic 14.2% |
| Hispanics or Latinos | 0.0 /100 | #312 | Tragic 14.3% |
| Barbadians | 0.0 /100 | #313 | Tragic 14.4% |
| Guyanese | 0.0 /100 | #314 | Tragic 14.4% |
| Immigrants | Ecuador | 0.0 /100 | #315 | Tragic 14.4% |
| Immigrants | Guyana | 0.0 /100 | #316 | Tragic 14.5% |
| Haitians | 0.0 /100 | #317 | Tragic 14.5% |
| Immigrants | Honduras | 0.0 /100 | #318 | Tragic 14.5% |
| Cape Verdeans | 0.0 /100 | #319 | Tragic 14.7% |
| Immigrants | Haiti | 0.0 /100 | #320 | Tragic 14.7% |
| Houma | 0.0 /100 | #321 | Tragic 14.7% |
| Immigrants | Barbados | 0.0 /100 | #322 | Tragic 14.8% |
| Yakama | 0.0 /100 | #323 | Tragic 14.8% |