Yup'ik vs Immigrants from Guyana Seniors Poverty Over the Age of 65
COMPARE
Yup'ik
Immigrants from Guyana
Seniors Poverty Over the Age of 65
Seniors Poverty Over the Age of 65 Comparison
Yup'ik
Immigrants from Guyana
14.1%
SENIORS POVERTY OVER THE AGE OF 65
0.0/ 100
METRIC RATING
302nd/ 347
METRIC RANK
14.5%
SENIORS POVERTY OVER THE AGE OF 65
0.0/ 100
METRIC RATING
316th/ 347
METRIC RANK
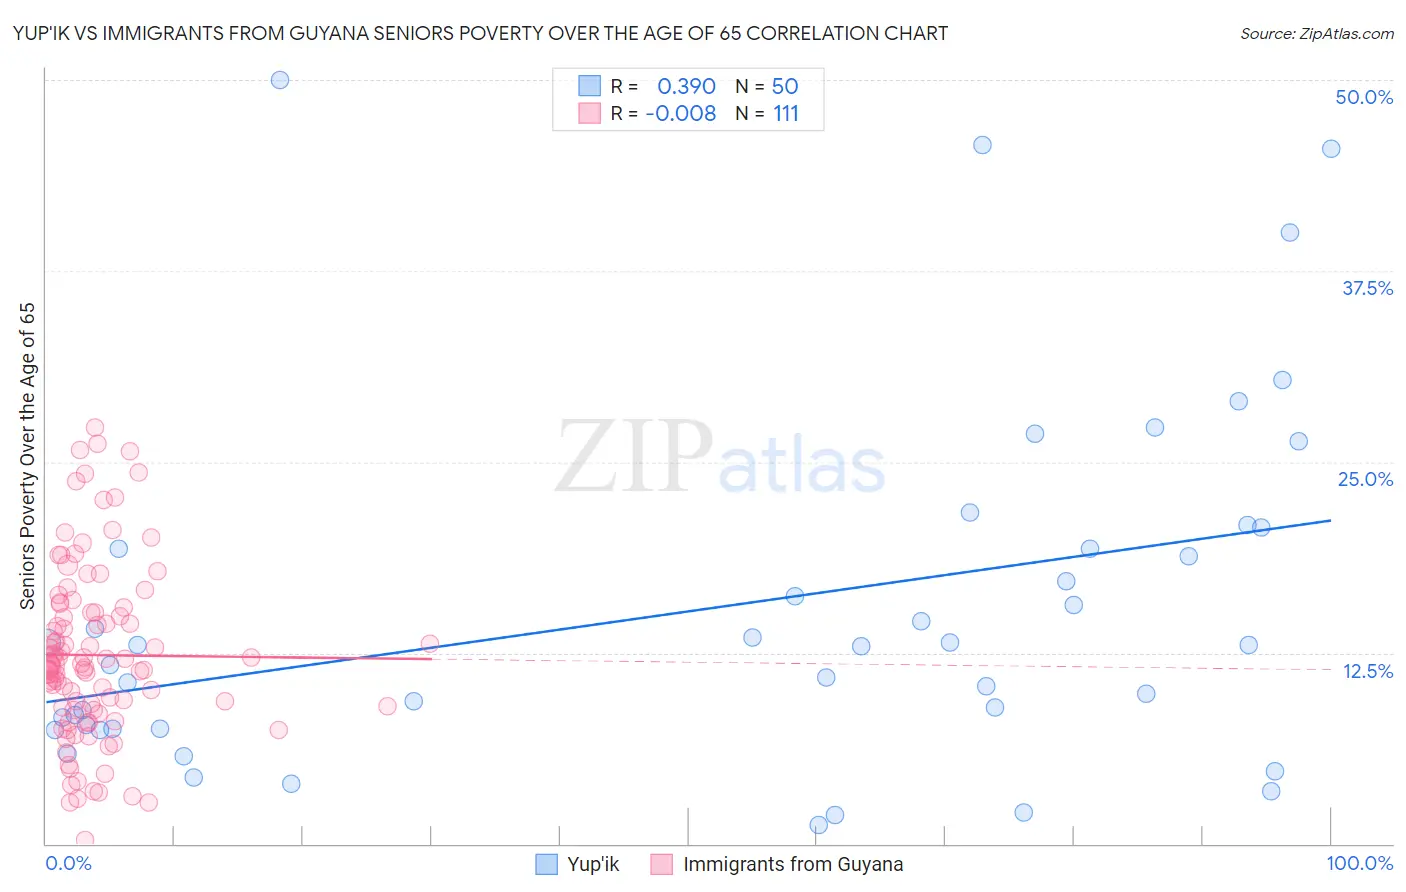
Yup'ik vs Immigrants from Guyana Seniors Poverty Over the Age of 65 Correlation Chart
The statistical analysis conducted on geographies consisting of 39,901,544 people shows a mild positive correlation between the proportion of Yup'ik and poverty level among seniors over the age of 65 in the United States with a correlation coefficient (R) of 0.390 and weighted average of 14.1%. Similarly, the statistical analysis conducted on geographies consisting of 183,396,619 people shows no correlation between the proportion of Immigrants from Guyana and poverty level among seniors over the age of 65 in the United States with a correlation coefficient (R) of -0.008 and weighted average of 14.5%, a difference of 2.9%.
Seniors Poverty Over the Age of 65 Correlation Summary
| Measurement | Yup'ik | Immigrants from Guyana |
| Minimum | 1.2% | 0.21% |
| Maximum | 50.0% | 27.3% |
| Range | 48.8% | 27.1% |
| Mean | 15.3% | 12.3% |
| Median | 13.0% | 11.7% |
| Interquartile 25% (IQ1) | 7.5% | 8.8% |
| Interquartile 75% (IQ3) | 19.3% | 15.2% |
| Interquartile Range (IQR) | 11.8% | 6.4% |
| Standard Deviation (Sample) | 11.5% | 5.7% |
| Standard Deviation (Population) | 11.4% | 5.6% |
Demographics Similar to Yup'ik and Immigrants from Guyana by Seniors Poverty Over the Age of 65
In terms of seniors poverty over the age of 65, the demographic groups most similar to Yup'ik are U.S. Virgin Islander (14.0%, a difference of 0.080%), Immigrants from Bangladesh (14.1%, a difference of 0.11%), Immigrants from Uzbekistan (14.0%, a difference of 0.28%), West Indian (14.1%, a difference of 0.35%), and Ecuadorian (14.0%, a difference of 0.36%). Similarly, the demographic groups most similar to Immigrants from Guyana are Haitian (14.5%, a difference of 0.030%), Immigrants from Ecuador (14.4%, a difference of 0.21%), Guyanese (14.4%, a difference of 0.24%), Immigrants from Honduras (14.5%, a difference of 0.24%), and Barbadian (14.4%, a difference of 0.64%).
| Demographics | Rating | Rank | Seniors Poverty Over the Age of 65 |
| Ecuadorians | 0.0 /100 | #299 | Tragic 14.0% |
| Immigrants | Uzbekistan | 0.0 /100 | #300 | Tragic 14.0% |
| U.S. Virgin Islanders | 0.0 /100 | #301 | Tragic 14.0% |
| Yup'ik | 0.0 /100 | #302 | Tragic 14.1% |
| Immigrants | Bangladesh | 0.0 /100 | #303 | Tragic 14.1% |
| West Indians | 0.0 /100 | #304 | Tragic 14.1% |
| Immigrants | Trinidad and Tobago | 0.0 /100 | #305 | Tragic 14.1% |
| Immigrants | Latin America | 0.0 /100 | #306 | Tragic 14.2% |
| Immigrants | West Indies | 0.0 /100 | #307 | Tragic 14.2% |
| Trinidadians and Tobagonians | 0.0 /100 | #308 | Tragic 14.2% |
| Hondurans | 0.0 /100 | #309 | Tragic 14.2% |
| Bahamians | 0.0 /100 | #310 | Tragic 14.2% |
| Natives/Alaskans | 0.0 /100 | #311 | Tragic 14.2% |
| Hispanics or Latinos | 0.0 /100 | #312 | Tragic 14.3% |
| Barbadians | 0.0 /100 | #313 | Tragic 14.4% |
| Guyanese | 0.0 /100 | #314 | Tragic 14.4% |
| Immigrants | Ecuador | 0.0 /100 | #315 | Tragic 14.4% |
| Immigrants | Guyana | 0.0 /100 | #316 | Tragic 14.5% |
| Haitians | 0.0 /100 | #317 | Tragic 14.5% |
| Immigrants | Honduras | 0.0 /100 | #318 | Tragic 14.5% |
| Cape Verdeans | 0.0 /100 | #319 | Tragic 14.7% |